Fish List, sodium Content per 100g
|
|
|
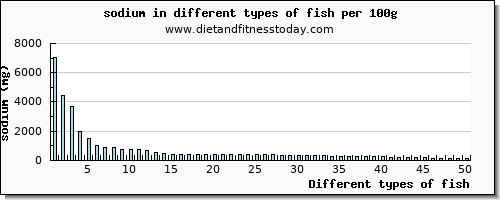
| 1. Fish, cod, Atlantic, dried and salted - Sodium |
| Nutritional Value : 16.00 / 100 food group - Finfish and Shellfish Products |
Sodium
(%RDA) | Potassium
(%RDA) | Energy
(%RDA) | Carbohydrate
(%RDA) | Total Fat
(%RDA) | Protein
(%RDA) |
| Profile for a 100g serving : |
| 7027.00 mg (439%) | 1458.00 mg (31%) | 290.00 kcal (15%) | 0.00 g (0%) | 2.37 g (4%) | 62.82 g (112%) | |
| Typical Serving size of 1.000 oz (or 28.35g): |
| 1992.15 mg (125%) | 413.34 mg (9%) | 82.22 kcal (4%) | 0 g (0%) | 0.67 g (1%) | 17.81 g (32%) | |
| Other serving sizes 1.000 piece (5-1/2" x 1-1/2" x 1/2") (or 80.00g): |
| 5621.6 mg (351%) | 1166.4 mg (25%) | 232 kcal (12%) | 0 g (0%) | 1.9 g (3%) | 50.26 g (90%) | |
| Other serving sizes 3.000 oz (or 85.00g): |
| 5972.95 mg (373%) | 1239.3 mg (26%) | 246.5 kcal (12%) | 0 g (0%) | 2.01 g (3%) | 53.4 g (95%) | |
| 2. Fish, mackerel, salted - Sodium |
| Nutritional Value : 14.00 / 100 food group - Finfish and Shellfish Products |
| Sodium | Potassium | Energy | Carbohydrate | Total Fat | Protein |
| Profile for a 100g serving : |
| 4450.00 mg (278%) | 520.00 mg (11%) | 305.00 kcal (15%) | 0.00 g (0%) | 25.10 g (39%) | 18.50 g (33%) | |
| Typical Serving size of 1.000 piece (5-1/2" x 1-1/2" x 1/2") (or 80.00g): |
| 3560 mg (223%) | 416 mg (9%) | 244 kcal (12%) | 0 g (0%) | 20.08 g (31%) | 14.8 g (26%) | |
| Other serving sizes 1.000 cubic inch and boneless (or 17.00g): |
| 756.5 mg (47%) | 88.4 mg (2%) | 51.85 kcal (3%) | 0 g (0%) | 4.27 g (7%) | 3.15 g (6%) | |
| Other serving sizes 1.000 cup and cooked (or 136.00g): |
| 6052 mg (378%) | 707.2 mg (15%) | 414.8 kcal (21%) | 0 g (0%) | 34.14 g (53%) | 25.16 g (45%) | |
| 3. Fish, anchovy, european, canned in oil, drained solids - Sodium |
| Nutritional Value : 15.00 / 100 food group - Finfish and Shellfish Products |
| Sodium | Potassium | Energy | Carbohydrate | Total Fat | Protein |
| Profile for a 100g serving : |
| 3668.00 mg (229%) | 544.00 mg (12%) | 210.00 kcal (11%) | 0.00 g (0%) | 9.71 g (15%) | 28.89 g (52%) | |
| Typical Serving size of 1.000 oz and boneless (or 28.35g): |
| 1039.88 mg (65%) | 154.22 mg (3%) | 59.54 kcal (3%) | 0 g (0%) | 2.75 g (4%) | 8.19 g (15%) | |
| Other serving sizes 1.000 anchovy (or 4.00g): |
| 146.72 mg (9%) | 21.76 mg (0%) | 8.4 kcal (0%) | 0 g (0%) | 0.39 g (1%) | 1.16 g (2%) | |
| Other serving sizes 1.000 can (2 oz) (or 45.00g): |
| 1650.6 mg (103%) | 244.8 mg (5%) | 94.5 kcal (5%) | 0 g (0%) | 4.37 g (7%) | 13 g (23%) | |
| Other serving sizes 5.000 anchovies (or 20.00g): |
| 733.6 mg (46%) | 108.8 mg (2%) | 42 kcal (2%) | 0 g (0%) | 1.94 g (3%) | 5.78 g (10%) | |
| 4. Fish, salmon, chinook, smoked, (lox), regular - Sodium |
| Nutritional Value : 13.00 / 100 food group - Finfish and Shellfish Products |
| Sodium | Potassium | Energy | Carbohydrate | Total Fat | Protein |
| Profile for a 100g serving : |
| 2000.00 mg (125%) | 175.00 mg (4%) | 117.00 kcal (6%) | 0.00 g (0%) | 4.32 g (7%) | 18.28 g (33%) | |
| Typical Serving size of 1.000 oz (or 28.35g): |
| 567 mg (35%) | 49.61 mg (1%) | 33.17 kcal (2%) | 0 g (0%) | 1.22 g (2%) | 5.18 g (9%) | |
| Other serving sizes 3.000 oz (or 85.00g): |
| 1700 mg (106%) | 148.75 mg (3%) | 99.45 kcal (5%) | 0 g (0%) | 3.67 g (6%) | 15.54 g (28%) | |
| 5. Fish, caviar, black and red, granular - Sodium |
| Nutritional Value : 16.00 / 100 food group - Finfish and Shellfish Products |
| Sodium | Potassium | Energy | Carbohydrate | Total Fat | Protein |
| Profile for a 100g serving : |
| 1500.00 mg (94%) | 181.00 mg (4%) | 264.00 kcal (13%) | 4.00 g (3%) | 17.90 g (28%) | 24.60 g (44%) | |
| Typical Serving size of 1.000 tbsp (or 16.00g): |
| 240 mg (15%) | 28.96 mg (1%) | 42.24 kcal (2%) | 0.64 g (0%) | 2.86 g (4%) | 3.94 g (7%) | |
| Other serving sizes 1.000 oz (or 28.35g): |
| 425.25 mg (27%) | 51.31 mg (1%) | 74.84 kcal (4%) | 1.13 g (1%) | 5.07 g (8%) | 6.97 g (12%) | |
| 6. Fish, whitefish, mixed species, smoked - Sodium |
| Nutritional Value : 15.00 / 100 food group - Finfish and Shellfish Products |
| Sodium | Potassium | Energy | Carbohydrate | Total Fat | Protein |
| Profile for a 100g serving : |
| 1019.00 mg (64%) | 423.00 mg (9%) | 108.00 kcal (5%) | 0.00 g (0%) | 0.93 g (1%) | 23.40 g (42%) | |
| Typical Serving size of 1.000 cup and cooked (or 136.00g): |
| 1385.84 mg (87%) | 575.28 mg (12%) | 146.88 kcal (7%) | 0 g (0%) | 1.26 g (2%) | 31.82 g (57%) | |
| Other serving sizes 1.000 oz and boneless (or 28.35g): |
| 288.89 mg (18%) | 119.92 mg (3%) | 30.62 kcal (2%) | 0 g (0%) | 0.26 g (0%) | 6.63 g (12%) | |
| Other serving sizes 1.000 cubic inch and boneless (or 17.00g): |
| 173.23 mg (11%) | 71.91 mg (2%) | 18.36 kcal (1%) | 0 g (0%) | 0.16 g (0%) | 3.98 g (7%) | |
| Other serving sizes 3.000 oz (or 85.00g): |
| 866.15 mg (54%) | 359.55 mg (8%) | 91.8 kcal (5%) | 0 g (0%) | 0.79 g (1%) | 19.89 g (36%) | |
| 7. Fish, herring, Atlantic, kippered - Sodium |
| Nutritional Value : 15.00 / 100 food group - Finfish and Shellfish Products |
| Sodium | Potassium | Energy | Carbohydrate | Total Fat | Protein |
| Profile for a 100g serving : |
| 918.00 mg (57%) | 447.00 mg (10%) | 217.00 kcal (11%) | 0.00 g (0%) | 12.37 g (19%) | 24.58 g (44%) | |
| Typical Serving size of 1.000 oz and boneless (or 28.35g): |
| 260.25 mg (16%) | 126.72 mg (3%) | 61.52 kcal (3%) | 0 g (0%) | 3.51 g (5%) | 6.97 g (12%) | |
| Other serving sizes 1.000 cubic inch and boneless (or 17.00g): |
| 156.06 mg (10%) | 75.99 mg (2%) | 36.89 kcal (2%) | 0 g (0%) | 2.1 g (3%) | 4.18 g (7%) | |
| Other serving sizes 1.000 fillet and large (7" x 2-1/4" x 1/4") (or 65.00g): |
| 596.7 mg (37%) | 290.55 mg (6%) | 141.05 kcal (7%) | 0 g (0%) | 8.04 g (12%) | 15.98 g (29%) | |
| Other serving sizes 1.000 fillet and medium (5" x 1-3/4" x 1/4") (or 40.00g): |
| 367.2 mg (23%) | 178.8 mg (4%) | 86.8 kcal (4%) | 0 g (0%) | 4.95 g (8%) | 9.83 g (18%) | |
| Other serving sizes 1.000 fillet and small (2-3/8" x 1-3/8" x 1/4") (or 20.00g): |
| 183.6 mg (11%) | 89.4 mg (2%) | 43.4 kcal (2%) | 0 g (0%) | 2.47 g (4%) | 4.92 g (9%) | |
| 8. Fish, herring, Atlantic, pickled - Sodium |
| Nutritional Value : 14.00 / 100 food group - Finfish and Shellfish Products |
| Sodium | Potassium | Energy | Carbohydrate | Total Fat | Protein |
| Profile for a 100g serving : |
| 870.00 mg (54%) | 69.00 mg (1%) | 262.00 kcal (13%) | 9.64 g (7%) | 18.00 g (28%) | 14.19 g (25%) | |
| Typical Serving size of 1.000 cup (or 140.00g): |
| 1218 mg (76%) | 96.6 mg (2%) | 366.8 kcal (18%) | 13.5 g (10%) | 25.2 g (39%) | 19.87 g (35%) | |
| Other serving sizes 1.000 oz and boneless (or 28.35g): |
| 246.65 mg (15%) | 19.56 mg (0%) | 74.28 kcal (4%) | 2.73 g (2%) | 5.1 g (8%) | 4.02 g (7%) | |
| Other serving sizes 1.000 cubic inch (or 20.00g): |
| 174 mg (11%) | 13.8 mg (0%) | 52.4 kcal (3%) | 1.93 g (1%) | 3.6 g (6%) | 2.84 g (5%) | |
| Other serving sizes 1.000 piece (1-3/4" x 7/8" x 1/2") (or 15.00g): |
| 130.5 mg (8%) | 10.35 mg (0%) | 39.3 kcal (2%) | 1.45 g (1%) | 2.7 g (4%) | 2.13 g (4%) | |
| 9. Fish, haddock, smoked - Sodium |
| Nutritional Value : 16.00 / 100 food group - Finfish and Shellfish Products |
| Sodium | Potassium | Energy | Carbohydrate | Total Fat | Protein |
| Profile for a 100g serving : |
| 763.00 mg (48%) | 415.00 mg (9%) | 116.00 kcal (6%) | 0.00 g (0%) | 0.96 g (1%) | 25.23 g (45%) | |
| Typical Serving size of 1.000 oz and boneless (or 28.35g): |
| 216.31 mg (14%) | 117.65 mg (3%) | 32.89 kcal (2%) | 0 g (0%) | 0.27 g (0%) | 7.15 g (13%) | |
| Other serving sizes 1.000 cubic inch and boneless (or 17.00g): |
| 129.71 mg (8%) | 70.55 mg (2%) | 19.72 kcal (1%) | 0 g (0%) | 0.16 g (0%) | 4.29 g (8%) | |
| Other serving sizes 3.000 oz (or 85.00g): |
| 648.55 mg (41%) | 352.75 mg (8%) | 98.6 kcal (5%) | 0 g (0%) | 0.82 g (1%) | 21.45 g (38%) | |
| 10. Fish, sturgeon, mixed species, smoked - Sodium |
| Nutritional Value : 15.00 / 100 food group - Finfish and Shellfish Products |
| Sodium | Potassium | Energy | Carbohydrate | Total Fat | Protein |
| Profile for a 100g serving : |
| 739.00 mg (46%) | 379.00 mg (8%) | 173.00 kcal (9%) | 0.00 g (0%) | 4.40 g (7%) | 31.20 g (56%) | |
| Typical Serving size of 1.000 oz (or 28.35g): |
| 209.51 mg (13%) | 107.45 mg (2%) | 49.05 kcal (2%) | 0 g (0%) | 1.25 g (2%) | 8.85 g (16%) | |
| Other serving sizes 3.000 oz (or 85.00g): |
| 628.15 mg (39%) | 322.15 mg (7%) | 147.05 kcal (7%) | 0 g (0%) | 3.74 g (6%) | 26.52 g (47%) | |
| 11. Fish, sablefish, smoked - Sodium |
| Nutritional Value : 14.00 / 100 food group - Finfish and Shellfish Products |
| Sodium | Potassium | Energy | Carbohydrate | Total Fat | Protein |
| Profile for a 100g serving : |
| 737.00 mg (46%) | 471.00 mg (10%) | 257.00 kcal (13%) | 0.00 g (0%) | 20.14 g (31%) | 17.65 g (32%) | |
| Typical Serving size of 1.000 oz (or 28.35g): |
| 208.94 mg (13%) | 133.53 mg (3%) | 72.86 kcal (4%) | 0 g (0%) | 5.71 g (9%) | 5 g (9%) | |
| Other serving sizes 3.000 oz (or 85.00g): |
| 626.45 mg (39%) | 400.35 mg (9%) | 218.45 kcal (11%) | 0 g (0%) | 17.12 g (26%) | 15 g (27%) | |
| 12. Fish, salmon, chinook, smoked - Sodium |
| Nutritional Value : 15.00 / 100 food group - Finfish and Shellfish Products |
| Sodium | Potassium | Energy | Carbohydrate | Total Fat | Protein |
| Profile for a 100g serving : |
| 672.00 mg (42%) | 175.00 mg (4%) | 117.00 kcal (6%) | 0.00 g (0%) | 4.32 g (7%) | 18.28 g (33%) | |
| Typical Serving size of 1.000 oz and boneless (or 28.35g): |
| 190.51 mg (12%) | 49.61 mg (1%) | 33.17 kcal (2%) | 0 g (0%) | 1.22 g (2%) | 5.18 g (9%) | |
| Other serving sizes 3.000 oz (or 85.00g): |
| 571.2 mg (36%) | 148.75 mg (3%) | 99.45 kcal (5%) | 0 g (0%) | 3.67 g (6%) | 15.54 g (28%) | |
| Other serving sizes 1.000 cubic inch and boneless (or 17.00g): |
| 114.24 mg (7%) | 29.75 mg (1%) | 19.89 kcal (1%) | 0 g (0%) | 0.73 g (1%) | 3.11 g (6%) | |
| Other serving sizes 1.000 cup and cooked (or 136.00g): |
| 913.92 mg (57%) | 238 mg (5%) | 159.12 kcal (8%) | 0 g (0%) | 5.88 g (9%) | 24.86 g (44%) | |
| 13. Fish, gefiltefish, commercial, sweet recipe - Sodium |
| Nutritional Value : 15.00 / 100 food group - Finfish and Shellfish Products |
| Sodium | Potassium | Energy | Carbohydrate | Total Fat | Protein |
| Profile for a 100g serving : |
| 524.00 mg (33%) | 91.00 mg (2%) | 84.00 kcal (4%) | 7.41 g (6%) | 1.73 g (3%) | 9.07 g (16%) | |
| Typical Serving size of 1.000 piece (or 42.00g): |
| 220.08 mg (14%) | 38.22 mg (1%) | 35.28 kcal (2%) | 3.11 g (2%) | 0.73 g (1%) | 3.81 g (7%) | |
| 14. Fish, cisco, smoked - Sodium |
| Nutritional Value : 15.00 / 100 food group - Finfish and Shellfish Products |
| Sodium | Potassium | Energy | Carbohydrate | Total Fat | Protein |
| Profile for a 100g serving : |
| 481.00 mg (30%) | 293.00 mg (6%) | 177.00 kcal (9%) | 0.00 g (0%) | 11.90 g (18%) | 16.36 g (29%) | |
| Typical Serving size of 1.000 oz (or 28.35g): |
| 136.36 mg (9%) | 83.07 mg (2%) | 50.18 kcal (3%) | 0 g (0%) | 3.37 g (5%) | 4.64 g (8%) | |
| Other serving sizes 3.000 oz (or 85.00g): |
| 408.85 mg (26%) | 249.05 mg (5%) | 150.45 kcal (8%) | 0 g (0%) | 10.12 g (16%) | 13.91 g (25%) | |
| 15. Fish, pollock, Alaska, cooked, dry heat (may have been previously frozen) - Sodium |
| Nutritional Value : 16.00 / 100 food group - Finfish and Shellfish Products |
| Sodium | Potassium | Energy | Carbohydrate | Total Fat | Protein |
| Profile for a 100g serving : |
| 419.00 mg (26%) | 430.00 mg (9%) | 111.00 kcal (6%) | 0.00 g (0%) | 1.18 g (2%) | 23.48 g (42%) | |
| Typical Serving size of 1.000 fillet (or 60.00g): |
| 251.4 mg (16%) | 258 mg (5%) | 66.6 kcal (3%) | 0 g (0%) | 0.71 g (1%) | 14.09 g (25%) | |
| Other serving sizes 3.000 oz (or 85.00g): |
| 356.15 mg (22%) | 365.5 mg (8%) | 94.35 kcal (5%) | 0 g (0%) | 1 g (2%) | 19.96 g (36%) | |
| 16. Fish, tuna, light, canned in oil, drained solids - Sodium |
| Nutritional Value : 15.00 / 100 food group - Finfish and Shellfish Products |
| Sodium | Potassium | Energy | Carbohydrate | Total Fat | Protein |
| Profile for a 100g serving : |
| 416.00 mg (26%) | 207.00 mg (4%) | 198.00 kcal (10%) | 0.00 g (0%) | 8.21 g (13%) | 29.13 g (52%) | |
| Typical Serving size of 1.000 cup and solid or chunks (or 146.00g): |
| 607.36 mg (38%) | 302.22 mg (6%) | 289.08 kcal (14%) | 0 g (0%) | 11.99 g (18%) | 42.53 g (76%) | |
| Other serving sizes 1.000 oz (or 28.35g): |
| 117.94 mg (7%) | 58.68 mg (1%) | 56.13 kcal (3%) | 0 g (0%) | 2.33 g (4%) | 8.26 g (15%) | |
| Other serving sizes 1.000 can (or 171.00g): |
| 711.36 mg (44%) | 353.97 mg (8%) | 338.58 kcal (17%) | 0 g (0%) | 14.04 g (22%) | 49.81 g (89%) | |
| Other serving sizes 3.000 oz (or 85.00g): |
| 353.6 mg (22%) | 175.95 mg (4%) | 168.3 kcal (8%) | 0 g (0%) | 6.98 g (11%) | 24.76 g (44%) | |
| Other serving sizes 1.000 can (12.5 oz) and drained (or 321.00g): |
| 1335.36 mg (83%) | 664.47 mg (14%) | 635.58 kcal (32%) | 0 g (0%) | 26.35 g (41%) | 93.51 g (167%) | |
| 17. Fish, sardine, Pacific, canned in tomato sauce, drained solids with bone - Sodium |
| Nutritional Value : 16.00 / 100 food group - Finfish and Shellfish Products |
| Sodium | Potassium | Energy | Carbohydrate | Total Fat | Protein |
| Profile for a 100g serving : |
| 414.00 mg (26%) | 341.00 mg (7%) | 185.00 kcal (9%) | 0.54 g (0%) | 10.45 g (16%) | 20.86 g (37%) | |
| Typical Serving size of 1.000 cup (or 89.00g): |
| 368.46 mg (23%) | 303.49 mg (6%) | 164.65 kcal (8%) | 0.48 g (0%) | 9.3 g (14%) | 18.57 g (33%) | |
| Other serving sizes 1.000 can (or 370.00g): |
| 1531.8 mg (96%) | 1261.7 mg (27%) | 684.5 kcal (34%) | 2 g (2%) | 38.67 g (59%) | 77.18 g (138%) | |
| Other serving sizes 1.000 sardine (or 38.00g): |
| 157.32 mg (10%) | 129.58 mg (3%) | 70.3 kcal (4%) | 0.21 g (0%) | 3.97 g (6%) | 7.93 g (14%) | |
| 18. Fish, salmon, sockeye, canned, drained solids - Sodium |
| Nutritional Value : 15.00 / 100 food group - Finfish and Shellfish Products |
| Sodium | Potassium | Energy | Carbohydrate | Total Fat | Protein |
| Profile for a 100g serving : |
| 408.00 mg (26%) | 314.00 mg (7%) | 167.00 kcal (8%) | 0.00 g (0%) | 7.39 g (11%) | 23.59 g (42%) | |
| Typical Serving size of 3.000 oz (or 85.00g): |
| 346.8 mg (22%) | 266.9 mg (6%) | 141.95 kcal (7%) | 0 g (0%) | 6.28 g (10%) | 20.05 g (36%) | |
| Other serving sizes 1.000 can (or 337.00g): |
| 1374.96 mg (86%) | 1058.18 mg (23%) | 562.79 kcal (28%) | 0 g (0%) | 24.9 g (38%) | 79.5 g (142%) | |
| 19. Fish, salmon, pink, canned, total can contents - Sodium |
| Nutritional Value : 16.00 / 100 food group - Finfish and Shellfish Products |
| Sodium | Potassium | Energy | Carbohydrate | Total Fat | Protein |
| Profile for a 100g serving : |
| 403.00 mg (25%) | 344.00 mg (7%) | 129.00 kcal (6%) | 0.00 g (0%) | 4.97 g (8%) | 19.68 g (35%) | |
| Typical Serving size of 3.000 oz (or 85.00g): |
| 342.55 mg (21%) | 292.4 mg (6%) | 109.65 kcal (5%) | 0 g (0%) | 4.22 g (6%) | 16.73 g (30%) | |
| Other serving sizes 1.000 can (or 411.00g): |
| 1656.33 mg (104%) | 1413.84 mg (30%) | 530.19 kcal (27%) | 0 g (0%) | 20.43 g (31%) | 80.88 g (144%) | |
| 20. Fish, fish sticks, frozen, prepared - Sodium |
| Nutritional Value : 14.00 / 100 food group - Finfish and Shellfish Products |
| Sodium | Potassium | Energy | Carbohydrate | Total Fat | Protein |
| Profile for a 100g serving : |
| 402.00 mg (25%) | 185.00 mg (4%) | 277.00 kcal (14%) | 21.66 g (17%) | 16.23 g (25%) | 11.01 g (20%) | |
| Typical Serving size of 1.000 piece (4" x 2" x 1/2") (or 57.00g): |
| 229.14 mg (14%) | 105.45 mg (2%) | 157.89 kcal (8%) | 12.35 g (10%) | 9.25 g (14%) | 6.28 g (11%) | |
| Other serving sizes 1.000 stick (4" x 1" x 1/2") (or 28.00g): |
| 112.56 mg (7%) | 51.8 mg (1%) | 77.56 kcal (4%) | 6.06 g (5%) | 4.54 g (7%) | 3.08 g (6%) | |
| 21. Fish, tuna salad - Sodium |
| Nutritional Value : 14.00 / 100 food group - Finfish and Shellfish Products |
| Sodium | Potassium | Energy | Carbohydrate | Total Fat | Protein |
| Profile for a 100g serving : |
| 402.00 mg (25%) | 178.00 mg (4%) | 187.00 kcal (9%) | 9.41 g (7%) | 9.26 g (14%) | 16.04 g (29%) | |
| Typical Serving size of 3.000 oz (or 85.00g): |
| 341.7 mg (21%) | 151.3 mg (3%) | 158.95 kcal (8%) | 8 g (6%) | 7.87 g (12%) | 13.63 g (24%) | |
| Other serving sizes 1.000 cup (or 205.00g): |
| 824.1 mg (52%) | 364.9 mg (8%) | 383.35 kcal (19%) | 19.29 g (15%) | 18.98 g (29%) | 32.88 g (59%) | |
| 22. Fish, tuna, white, canned in oil, drained solids - Sodium |
| Nutritional Value : 15.00 / 100 food group - Finfish and Shellfish Products |
| Sodium | Potassium | Energy | Carbohydrate | Total Fat | Protein |
| Profile for a 100g serving : |
| 396.00 mg (25%) | 333.00 mg (7%) | 186.00 kcal (9%) | 0.00 g (0%) | 8.08 g (12%) | 26.53 g (47%) | |
| Typical Serving size of 3.000 oz (or 85.00g): |
| 336.6 mg (21%) | 283.05 mg (6%) | 158.1 kcal (8%) | 0 g (0%) | 6.87 g (11%) | 22.55 g (40%) | |
| Other serving sizes 1.000 can (or 178.00g): |
| 704.88 mg (44%) | 592.74 mg (13%) | 331.08 kcal (17%) | 0 g (0%) | 14.38 g (22%) | 47.22 g (84%) | |
| 23. Fish, salmon, chum, canned, drained solids with bone - Sodium |
| Nutritional Value : 16.00 / 100 food group - Finfish and Shellfish Products |
| Sodium | Potassium | Energy | Carbohydrate | Total Fat | Protein |
| Profile for a 100g serving : |
| 391.00 mg (24%) | 300.00 mg (6%) | 141.00 kcal (7%) | 0.00 g (0%) | 5.50 g (8%) | 21.43 g (38%) | |
| Typical Serving size of 3.000 oz (or 85.00g): |
| 332.35 mg (21%) | 255 mg (5%) | 119.85 kcal (6%) | 0 g (0%) | 4.68 g (7%) | 18.22 g (33%) | |
| Other serving sizes 1.000 can (or 369.00g): |
| 1442.79 mg (90%) | 1107 mg (24%) | 520.29 kcal (26%) | 0 g (0%) | 20.3 g (31%) | 79.08 g (141%) | |
| 24. Fish, salmon, pink, canned, drained solids - Sodium |
| Nutritional Value : 16.00 / 100 food group - Finfish and Shellfish Products |
| Sodium | Potassium | Energy | Carbohydrate | Total Fat | Protein |
| Profile for a 100g serving : |
| 381.00 mg (24%) | 333.00 mg (7%) | 138.00 kcal (7%) | 0.00 g (0%) | 5.02 g (8%) | 23.10 g (41%) | |
| Typical Serving size of 3.000 oz (or 85.00g): |
| 323.85 mg (20%) | 283.05 mg (6%) | 117.3 kcal (6%) | 0 g (0%) | 4.27 g (7%) | 19.64 g (35%) | |
| Other serving sizes 1.000 can drained solids (total) (or 315.00g): |
| 1200.15 mg (75%) | 1048.95 mg (22%) | 434.7 kcal (22%) | 0 g (0%) | 15.81 g (24%) | 72.77 g (130%) | |
| 25. Fish, mackerel, jack, canned, drained solids - Sodium |
| Nutritional Value : 16.00 / 100 food group - Finfish and Shellfish Products |
| Sodium | Potassium | Energy | Carbohydrate | Total Fat | Protein |
| Profile for a 100g serving : |
| 379.00 mg (24%) | 194.00 mg (4%) | 156.00 kcal (8%) | 0.00 g (0%) | 6.30 g (10%) | 23.19 g (41%) | |
| Typical Serving size of 1.000 oz and boneless (or 28.35g): |
| 107.45 mg (7%) | 55 mg (1%) | 44.23 kcal (2%) | 0 g (0%) | 1.79 g (3%) | 6.57 g (12%) | |
| Other serving sizes 1.000 cup (or 190.00g): |
| 720.1 mg (45%) | 368.6 mg (8%) | 296.4 kcal (15%) | 0 g (0%) | 11.97 g (18%) | 44.06 g (79%) | |
| Other serving sizes 1.000 cubic inch (or 16.00g): |
| 60.64 mg (4%) | 31.04 mg (1%) | 24.96 kcal (1%) | 0 g (0%) | 1.01 g (2%) | 3.71 g (7%) | |
| Other serving sizes 1.000 can (15 oz) (or 361.00g): |
| 1368.19 mg (86%) | 700.34 mg (15%) | 563.16 kcal (28%) | 0 g (0%) | 22.74 g (35%) | 83.72 g (150%) | |
| 26. Fish, Salmon, pink, canned, drained solids, without skin and bones - Sodium |
| Nutritional Value : 15.00 / 100 food group - Finfish and Shellfish Products |
| Sodium | Potassium | Energy | Carbohydrate | Total Fat | Protein |
| Profile for a 100g serving : |
| 378.00 mg (24%) | 326.00 mg (7%) | 136.00 kcal (7%) | 0.00 g (0%) | 4.21 g (6%) | 24.62 g (44%) | |
| Typical Serving size of 3.000 oz (or 85.00g): |
| 321.3 mg (20%) | 277.1 mg (6%) | 115.6 kcal (6%) | 0 g (0%) | 3.58 g (6%) | 20.93 g (37%) | |
| Other serving sizes 1.000 can drained solids and bone and skin removed (or 242.00g): |
| 914.76 mg (57%) | 788.92 mg (17%) | 329.12 kcal (16%) | 0 g (0%) | 10.19 g (16%) | 59.58 g (106%) | |
| 27. Fish, tuna, white, canned in water, drained solids - Sodium |
| Nutritional Value : 15.00 / 100 food group - Finfish and Shellfish Products |
| Sodium | Potassium | Energy | Carbohydrate | Total Fat | Protein |
| Profile for a 100g serving : |
| 377.00 mg (24%) | 237.00 mg (5%) | 128.00 kcal (6%) | 0.00 g (0%) | 2.97 g (5%) | 23.62 g (42%) | |
| Typical Serving size of 3.000 oz (or 85.00g): |
| 320.45 mg (20%) | 201.45 mg (4%) | 108.8 kcal (5%) | 0 g (0%) | 2.52 g (4%) | 20.08 g (36%) | |
| Other serving sizes 1.000 can (or 172.00g): |
| 648.44 mg (41%) | 407.64 mg (9%) | 220.16 kcal (11%) | 0 g (0%) | 5.11 g (8%) | 40.63 g (73%) | |
| 28. Fish, cod, Pacific, cooked, dry heat (may have been previously frozen) - Sodium |
| Nutritional Value : 16.00 / 100 food group - Finfish and Shellfish Products |
| Sodium | Potassium | Energy | Carbohydrate | Total Fat | Protein |
| Profile for a 100g serving : |
| 372.00 mg (23%) | 289.00 mg (6%) | 85.00 kcal (4%) | 0.00 g (0%) | 0.50 g (1%) | 18.73 g (33%) | |
| Typical Serving size of 1.000 fillet (or 90.00g): |
| 334.8 mg (21%) | 260.1 mg (6%) | 76.5 kcal (4%) | 0 g (0%) | 0.45 g (1%) | 16.86 g (30%) | |
| Other serving sizes 3.000 oz (or 85.00g): |
| 316.2 mg (20%) | 245.65 mg (5%) | 72.25 kcal (4%) | 0 g (0%) | 0.43 g (1%) | 15.92 g (28%) | |
| 29. Fish, flatfish (flounder and sole species), cooked, dry heat - Sodium |
| Nutritional Value : 15.00 / 100 food group - Finfish and Shellfish Products |
| Sodium | Potassium | Energy | Carbohydrate | Total Fat | Protein |
| Profile for a 100g serving : |
| 363.00 mg (23%) | 197.00 mg (4%) | 86.00 kcal (4%) | 0.00 g (0%) | 2.37 g (4%) | 15.24 g (27%) | |
| Typical Serving size of 1.000 fillet (or 127.00g): |
| 461.01 mg (29%) | 250.19 mg (5%) | 109.22 kcal (5%) | 0 g (0%) | 3.01 g (5%) | 19.35 g (35%) | |
| Other serving sizes 3.000 oz (or 85.00g): |
| 308.55 mg (19%) | 167.45 mg (4%) | 73.1 kcal (4%) | 0 g (0%) | 2.01 g (3%) | 12.95 g (23%) | |
| 30. Fish, croaker, Atlantic, cooked, breaded and fried - Sodium |
| Nutritional Value : 14.00 / 100 food group - Finfish and Shellfish Products |
| Sodium | Potassium | Energy | Carbohydrate | Total Fat | Protein |
| Profile for a 100g serving : |
| 348.00 mg (22%) | 340.00 mg (7%) | 221.00 kcal (11%) | 7.54 g (6%) | 12.67 g (19%) | 18.20 g (33%) | |
| Typical Serving size of 1.000 fillet (or 87.00g): |
| 302.76 mg (19%) | 295.8 mg (6%) | 192.27 kcal (10%) | 6.56 g (5%) | 11.02 g (17%) | 15.83 g (28%) | |
| Other serving sizes 3.000 oz (or 85.00g): |
| 295.8 mg (18%) | 289 mg (6%) | 187.85 kcal (9%) | 6.41 g (5%) | 10.77 g (17%) | 15.47 g (28%) | |
| 31. Fish, ocean perch, Atlantic, cooked, dry heat - Sodium |
| Nutritional Value : 15.00 / 100 food group - Finfish and Shellfish Products |
| Sodium | Potassium | Energy | Carbohydrate | Total Fat | Protein |
| Profile for a 100g serving : |
| 347.00 mg (22%) | 226.00 mg (5%) | 96.00 kcal (5%) | 0.00 g (0%) | 1.87 g (3%) | 18.51 g (33%) | |
| Typical Serving size of 1.000 fillet (or 50.00g): |
| 173.5 mg (11%) | 113 mg (2%) | 48 kcal (2%) | 0 g (0%) | 0.94 g (1%) | 9.26 g (17%) | |
| Other serving sizes 3.000 oz (or 85.00g): |
| 294.95 mg (18%) | 192.1 mg (4%) | 81.6 kcal (4%) | 0 g (0%) | 1.59 g (2%) | 15.73 g (28%) | |
| 32. Fish, pollock, Alaska, raw (may have been previously frozen) - Sodium |
| Nutritional Value : 15.00 / 100 food group - Finfish and Shellfish Products |
| Sodium | Potassium | Energy | Carbohydrate | Total Fat | Protein |
| Profile for a 100g serving : |
| 333.00 mg (21%) | 160.00 mg (3%) | 56.00 kcal (3%) | 0.00 g (0%) | 0.41 g (1%) | 12.19 g (22%) | |
| Typical Serving size of 1.000 fillet (or 77.00g): |
| 256.41 mg (16%) | 123.2 mg (3%) | 43.12 kcal (2%) | 0 g (0%) | 0.32 g (0%) | 9.39 g (17%) | |
| Other serving sizes 3.000 oz (or 85.00g): |
| 283.05 mg (18%) | 136 mg (3%) | 47.6 kcal (2%) | 0 g (0%) | 0.35 g (1%) | 10.36 g (19%) | |
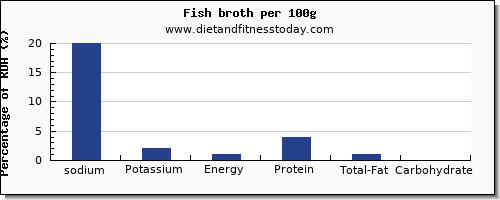
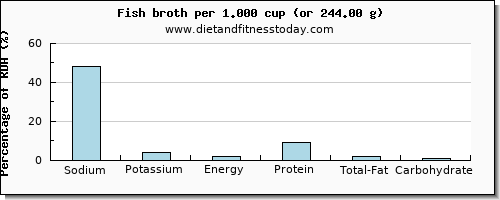
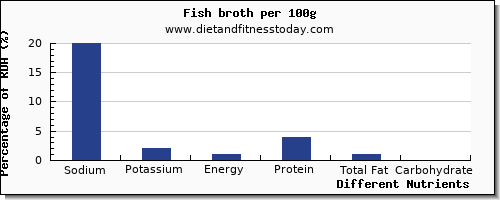
| 33. Fish broth - Sodium |
| Nutritional Value : 14.00 / 100 food group - |
| Sodium | Potassium | Energy | Carbohydrate | Total Fat | Protein |
| Profile for a 100g serving : |
| 318.00 mg (20%) | 86.00 mg (2%) | 16.00 kcal (1%) | 0.40 g (0%) | 0.60 g (1%) | 2.00 g (4%) | |
| Typical Serving size of 1.000 cup (or 244.00g): |
| 775.92 mg (48%) | 209.84 mg (4%) | 39.04 kcal (2%) | 0.98 g (1%) | 1.46 g (2%) | 4.88 g (9%) | |
| Other serving sizes 1.000 fl oz (or 30.50g): |
| 96.99 mg (6%) | 26.23 mg (1%) | 4.88 kcal (0%) | 0.12 g (0%) | 0.18 g (0%) | 0.61 g (1%) | |
| 34. Fish, sardine, Atlantic, canned in oil, drained solids with bone - Sodium |
| Nutritional Value : 16.00 / 100 food group - Finfish and Shellfish Products |
| Sodium | Potassium | Energy | Carbohydrate | Total Fat | Protein |
| Profile for a 100g serving : |
| 307.00 mg (19%) | 397.00 mg (8%) | 208.00 kcal (10%) | 0.00 g (0%) | 11.45 g (18%) | 24.62 g (44%) | |
| Typical Serving size of 1.000 cup and drained (or 149.00g): |
| 457.43 mg (29%) | 591.53 mg (13%) | 309.92 kcal (15%) | 0 g (0%) | 17.06 g (26%) | 36.68 g (66%) | |
| Other serving sizes 1.000 oz (or 28.35g): |
| 87.03 mg (5%) | 112.55 mg (2%) | 58.97 kcal (3%) | 0 g (0%) | 3.25 g (5%) | 6.98 g (12%) | |
| Other serving sizes 1.000 cubic inch (or 16.00g): |
| 49.12 mg (3%) | 63.52 mg (1%) | 33.28 kcal (2%) | 0 g (0%) | 1.83 g (3%) | 3.94 g (7%) | |
| Other serving sizes 1.000 can (3.75 oz) (or 92.00g): |
| 282.44 mg (18%) | 365.24 mg (8%) | 191.36 kcal (10%) | 0 g (0%) | 10.53 g (16%) | 22.65 g (40%) | |
| Other serving sizes 1.000 small (2-2/3" x 1/2" x 1/4") (or 12.00g): |
| 36.84 mg (2%) | 47.64 mg (1%) | 24.96 kcal (1%) | 0 g (0%) | 1.37 g (2%) | 2.95 g (5%) | |
| Other serving sizes 2.000 sardines (or 24.00g): |
| 73.68 mg (5%) | 95.28 mg (2%) | 49.92 kcal (2%) | 0 g (0%) | 2.75 g (4%) | 5.91 g (11%) | |
| 35. Fish, cod, Pacific, raw (may have been previously frozen) - Sodium |
| Nutritional Value : 16.00 / 100 food group - Finfish and Shellfish Products |
| Sodium | Potassium | Energy | Carbohydrate | Total Fat | Protein |
| Profile for a 100g serving : |
| 303.00 mg (19%) | 235.00 mg (5%) | 69.00 kcal (3%) | 0.00 g (0%) | 0.41 g (1%) | 15.27 g (27%) | |
| Typical Serving size of 1.000 fillet (or 116.00g): |
| 351.48 mg (22%) | 272.6 mg (6%) | 80.04 kcal (4%) | 0 g (0%) | 0.48 g (1%) | 17.71 g (32%) | |
| Other serving sizes 3.000 oz (or 85.00g): |
| 257.55 mg (16%) | 199.75 mg (4%) | 58.65 kcal (3%) | 0 g (0%) | 0.35 g (1%) | 12.98 g (23%) | |
| 36. Fish, flatfish (flounder and sole species), raw - Sodium |
| Nutritional Value : 15.00 / 100 food group - Finfish and Shellfish Products |
| Sodium | Potassium | Energy | Carbohydrate | Total Fat | Protein |
| Profile for a 100g serving : |
| 296.00 mg (19%) | 160.00 mg (3%) | 70.00 kcal (4%) | 0.00 g (0%) | 1.93 g (3%) | 12.41 g (22%) | |
| Typical Serving size of 1.000 oz and boneless (or 28.35g): |
| 83.92 mg (5%) | 45.36 mg (1%) | 19.85 kcal (1%) | 0 g (0%) | 0.55 g (1%) | 3.52 g (6%) | |
| Other serving sizes 1.000 fillet (or 163.00g): |
| 482.48 mg (30%) | 260.8 mg (6%) | 114.1 kcal (6%) | 0 g (0%) | 3.15 g (5%) | 20.23 g (36%) | |
| Other serving sizes 3.000 oz (or 85.00g): |
| 251.6 mg (16%) | 136 mg (3%) | 59.5 kcal (3%) | 0 g (0%) | 1.64 g (3%) | 10.55 g (19%) | |
| 37. Fish, ocean perch, Atlantic, raw - Sodium |
| Nutritional Value : 15.00 / 100 food group - Finfish and Shellfish Products |
| Sodium | Potassium | Energy | Carbohydrate | Total Fat | Protein |
| Profile for a 100g serving : |
| 287.00 mg (18%) | 187.00 mg (4%) | 79.00 kcal (4%) | 0.00 g (0%) | 1.54 g (2%) | 15.31 g (27%) | |
| Typical Serving size of 1.000 oz and boneless (or 28.35g): |
| 81.36 mg (5%) | 53.01 mg (1%) | 22.4 kcal (1%) | 0 g (0%) | 0.44 g (1%) | 4.34 g (8%) | |
| Other serving sizes 1.000 fillet (or 64.00g): |
| 183.68 mg (11%) | 119.68 mg (3%) | 50.56 kcal (3%) | 0 g (0%) | 0.99 g (2%) | 9.8 g (18%) | |
| Other serving sizes 3.000 oz (or 85.00g): |
| 243.95 mg (15%) | 158.95 mg (3%) | 67.15 kcal (3%) | 0 g (0%) | 1.31 g (2%) | 13.01 g (23%) | |
| 38. Fish, catfish, channel, cooked, breaded and fried - Sodium |
| Nutritional Value : 14.00 / 100 food group - Finfish and Shellfish Products |
| Sodium | Potassium | Energy | Carbohydrate | Total Fat | Protein |
| Profile for a 100g serving : |
| 280.00 mg (18%) | 340.00 mg (7%) | 229.00 kcal (11%) | 8.04 g (6%) | 13.33 g (21%) | 18.09 g (32%) | |
| Typical Serving size of 1.000 fillet (or 87.00g): |
| 243.6 mg (15%) | 295.8 mg (6%) | 199.23 kcal (10%) | 6.99 g (5%) | 11.6 g (18%) | 15.74 g (28%) | |
| Other serving sizes 3.000 oz (or 85.00g): |
| 238 mg (15%) | 289 mg (6%) | 194.65 kcal (10%) | 6.83 g (5%) | 11.33 g (17%) | 15.38 g (27%) | |
| 39. Fish, haddock, cooked, dry heat - Sodium |
| Nutritional Value : 16.00 / 100 food group - Finfish and Shellfish Products |
| Sodium | Potassium | Energy | Carbohydrate | Total Fat | Protein |
| Profile for a 100g serving : |
| 261.00 mg (16%) | 351.00 mg (7%) | 90.00 kcal (5%) | 0.00 g (0%) | 0.55 g (1%) | 19.99 g (36%) | |
| Typical Serving size of 1.000 fillet (or 150.00g): |
| 391.5 mg (24%) | 526.5 mg (11%) | 135 kcal (7%) | 0 g (0%) | 0.83 g (1%) | 29.99 g (54%) | |
| Other serving sizes 3.000 oz (or 85.00g): |
| 221.85 mg (14%) | 298.35 mg (6%) | 76.5 kcal (4%) | 0 g (0%) | 0.47 g (1%) | 16.99 g (30%) | |
| 40. Fish, tuna, light, canned in water, drained solids - Sodium |
| Nutritional Value : 16.00 / 100 food group - Finfish and Shellfish Products |
| Sodium | Potassium | Energy | Carbohydrate | Total Fat | Protein |
| Profile for a 100g serving : |
| 247.00 mg (15%) | 179.00 mg (4%) | 86.00 kcal (4%) | 0.00 g (0%) | 0.96 g (1%) | 19.44 g (35%) | |
| Typical Serving size of 1.000 oz (or 28.35g): |
| 70.02 mg (4%) | 50.75 mg (1%) | 24.38 kcal (1%) | 0 g (0%) | 0.27 g (0%) | 5.51 g (10%) | |
| Other serving sizes 3.000 oz (or 85.00g): |
| 209.95 mg (13%) | 152.15 mg (3%) | 73.1 kcal (4%) | 0 g (0%) | 0.82 g (1%) | 16.52 g (30%) | |
| Other serving sizes 1.000 can (or 165.00g): |
| 407.55 mg (25%) | 295.35 mg (6%) | 141.9 kcal (7%) | 0 g (0%) | 1.58 g (2%) | 32.08 g (57%) | |
| Other serving sizes 1.000 cup and solid or chunks (or 154.00g): |
| 380.38 mg (24%) | 275.66 mg (6%) | 132.44 kcal (7%) | 0 g (0%) | 1.48 g (2%) | 29.94 g (53%) | |
| Other serving sizes 1.000 can (12.5 oz) and drained (or 315.00g): |
| 778.05 mg (49%) | 563.85 mg (12%) | 270.9 kcal (14%) | 0 g (0%) | 3.02 g (5%) | 61.24 g (109%) | |
| 41. Fish, cod, Atlantic, canned, solids and liquid - Sodium |
| Nutritional Value : 17.00 / 100 food group - Finfish and Shellfish Products |
| Sodium | Potassium | Energy | Carbohydrate | Total Fat | Protein |
| Profile for a 100g serving : |
| 218.00 mg (14%) | 528.00 mg (11%) | 105.00 kcal (5%) | 0.00 g (0%) | 0.86 g (1%) | 22.76 g (41%) | |
| Typical Serving size of 3.000 oz (or 85.00g): |
| 185.3 mg (12%) | 448.8 mg (10%) | 89.25 kcal (4%) | 0 g (0%) | 0.73 g (1%) | 19.35 g (35%) | |
| Other serving sizes 1.000 can (or 312.00g): |
| 680.16 mg (43%) | 1647.36 mg (35%) | 327.6 kcal (16%) | 0 g (0%) | 2.68 g (4%) | 71.01 g (127%) | |
| 42. Fish, haddock, raw - Sodium |
| Nutritional Value : 16.00 / 100 food group - Finfish and Shellfish Products |
| Sodium | Potassium | Energy | Carbohydrate | Total Fat | Protein |
| Profile for a 100g serving : |
| 213.00 mg (13%) | 286.00 mg (6%) | 74.00 kcal (4%) | 0.00 g (0%) | 0.45 g (1%) | 16.32 g (29%) | |
| Typical Serving size of 3.000 oz (or 85.00g): |
| 181.05 mg (11%) | 243.1 mg (5%) | 62.9 kcal (3%) | 0 g (0%) | 0.38 g (1%) | 13.87 g (25%) | |
| Other serving sizes 1.000 fillet (or 193.00g): |
| 411.09 mg (26%) | 551.98 mg (12%) | 142.82 kcal (7%) | 0 g (0%) | 0.87 g (1%) | 31.5 g (56%) | |
| 43. Fish, mackerel, king, cooked, dry heat - Sodium |
| Nutritional Value : 16.00 / 100 food group - Finfish and Shellfish Products |
| Sodium | Potassium | Energy | Carbohydrate | Total Fat | Protein |
| Profile for a 100g serving : |
| 203.00 mg (13%) | 558.00 mg (12%) | 134.00 kcal (7%) | 0.00 g (0%) | 2.56 g (4%) | 26.00 g (46%) | |
| Typical Serving size of 3.000 oz (or 85.00g): |
| 172.55 mg (11%) | 474.3 mg (10%) | 113.9 kcal (6%) | 0 g (0%) | 2.18 g (3%) | 22.1 g (39%) | |
| Other serving sizes 0.500 fillet (or 154.00g): |
| 312.62 mg (20%) | 859.32 mg (18%) | 206.36 kcal (10%) | 0 g (0%) | 3.94 g (6%) | 40.04 g (72%) | |
| 44. Fish, turbot, european, cooked, dry heat - Sodium |
| Nutritional Value : 16.00 / 100 food group - Finfish and Shellfish Products |
| Sodium | Potassium | Energy | Carbohydrate | Total Fat | Protein |
| Profile for a 100g serving : |
| 192.00 mg (12%) | 305.00 mg (6%) | 122.00 kcal (6%) | 0.00 g (0%) | 3.78 g (6%) | 20.58 g (37%) | |
| Typical Serving size of 3.000 oz (or 85.00g): |
| 163.2 mg (10%) | 259.25 mg (6%) | 103.7 kcal (5%) | 0 g (0%) | 3.21 g (5%) | 17.49 g (31%) | |
| Other serving sizes 0.500 fillet (or 159.00g): |
| 305.28 mg (19%) | 484.95 mg (10%) | 193.98 kcal (10%) | 0 g (0%) | 6.01 g (9%) | 32.72 g (58%) | |
| 45. Fish, ling, cooked, dry heat - Sodium |
| Nutritional Value : 16.00 / 100 food group - Finfish and Shellfish Products |
| Sodium | Potassium | Energy | Carbohydrate | Total Fat | Protein |
| Profile for a 100g serving : |
| 173.00 mg (11%) | 486.00 mg (10%) | 111.00 kcal (6%) | 0.00 g (0%) | 0.82 g (1%) | 24.35 g (43%) | |
| Typical Serving size of 3.000 oz (or 85.00g): |
| 147.05 mg (9%) | 413.1 mg (9%) | 94.35 kcal (5%) | 0 g (0%) | 0.7 g (1%) | 20.7 g (37%) | |
| Other serving sizes 1.000 fillet (or 151.00g): |
| 261.23 mg (16%) | 733.86 mg (16%) | 167.61 kcal (8%) | 0 g (0%) | 1.24 g (2%) | 36.77 g (66%) | |
| 46. Fish, pollock, Alaska, cooked (not previously frozen) - Sodium |
| Nutritional Value : 15.00 / 100 food group - Finfish and Shellfish Products |
| Sodium | Potassium | Energy | Carbohydrate | Total Fat | Protein |
| Profile for a 100g serving : |
| 166.00 mg (10%) | 364.00 mg (8%) | 80.00 kcal (4%) | 0.00 g (0%) | 0.26 g (0%) | 19.42 g (35%) | |
| Typical Serving size of 3.000 oz (or 85.00g): |
| 141.1 mg (9%) | 309.4 mg (7%) | 68 kcal (3%) | 0 g (0%) | 0.22 g (0%) | 16.51 g (29%) | |
| 47. Fish, pollock, Alaska, raw (not previously frozen) - Sodium |
| Nutritional Value : 15.00 / 100 food group - Finfish and Shellfish Products |
| Sodium | Potassium | Energy | Carbohydrate | Total Fat | Protein |
| Profile for a 100g serving : |
| 159.00 mg (10%) | 331.00 mg (7%) | 70.00 kcal (4%) | 0.00 g (0%) | 0.19 g (0%) | 17.17 g (31%) | |
| Typical Serving size of 3.000 oz (or 85.00g): |
| 135.15 mg (8%) | 281.35 mg (6%) | 59.5 kcal (3%) | 0 g (0%) | 0.16 g (0%) | 14.59 g (26%) | |
| 48. Fish, mackerel, king, raw - Sodium |
| Nutritional Value : 16.00 / 100 food group - Finfish and Shellfish Products |
| Sodium | Potassium | Energy | Carbohydrate | Total Fat | Protein |
| Profile for a 100g serving : |
| 158.00 mg (10%) | 435.00 mg (9%) | 105.00 kcal (5%) | 0.00 g (0%) | 2.00 g (3%) | 20.28 g (36%) | |
| Typical Serving size of 3.000 oz (or 85.00g): |
| 134.3 mg (8%) | 369.75 mg (8%) | 89.25 kcal (4%) | 0 g (0%) | 1.7 g (3%) | 17.24 g (31%) | |
| Other serving sizes 0.500 fillet (or 198.00g): |
| 312.84 mg (20%) | 861.3 mg (18%) | 207.9 kcal (10%) | 0 g (0%) | 3.96 g (6%) | 40.15 g (72%) | |
| 49. Fish, turbot, european, raw - Sodium |
| Nutritional Value : 15.00 / 100 food group - Finfish and Shellfish Products |
| Sodium | Potassium | Energy | Carbohydrate | Total Fat | Protein |
| Profile for a 100g serving : |
| 150.00 mg (9%) | 238.00 mg (5%) | 95.00 kcal (5%) | 0.00 g (0%) | 2.95 g (5%) | 16.05 g (29%) | |
| Typical Serving size of 3.000 oz (or 85.00g): |
| 127.5 mg (8%) | 202.3 mg (4%) | 80.75 kcal (4%) | 0 g (0%) | 2.51 g (4%) | 13.64 g (24%) | |
| Other serving sizes 0.500 fillet (or 204.00g): |
| 306 mg (19%) | 485.52 mg (10%) | 193.8 kcal (10%) | 0 g (0%) | 6.02 g (9%) | 32.74 g (58%) | |
| 50. Fish, surimi - Sodium |
| Nutritional Value : 15.00 / 100 food group - Finfish and Shellfish Products |
| Sodium | Potassium | Energy | Carbohydrate | Total Fat | Protein |
| Profile for a 100g serving : |
| 143.00 mg (9%) | 112.00 mg (2%) | 99.00 kcal (5%) | 6.85 g (5%) | 0.90 g (1%) | 15.18 g (27%) | |
| Typical Serving size of 1.000 oz (or 28.35g): |
| 40.54 mg (3%) | 31.75 mg (1%) | 28.07 kcal (1%) | 1.94 g (1%) | 0.26 g (0%) | 4.3 g (8%) | |
| Other serving sizes 3.000 oz (or 85.00g): |
| 121.55 mg (8%) | 95.2 mg (2%) | 84.15 kcal (4%) | 5.82 g (4%) | 0.77 g (1%) | 12.9 g (23%) | |
| 51. Fish, ling, raw - Sodium |
| Nutritional Value : 16.00 / 100 food group - Finfish and Shellfish Products |
| Sodium | Potassium | Energy | Carbohydrate | Total Fat | Protein |
| Profile for a 100g serving : |
| 135.00 mg (8%) | 379.00 mg (8%) | 87.00 kcal (4%) | 0.00 g (0%) | 0.64 g (1%) | 18.99 g (34%) | |
| Typical Serving size of 3.000 oz (or 85.00g): |
| 114.75 mg (7%) | 322.15 mg (7%) | 73.95 kcal (4%) | 0 g (0%) | 0.54 g (1%) | 16.14 g (29%) | |
| Other serving sizes 1.000 fillet (or 193.00g): |
| 260.55 mg (16%) | 731.47 mg (16%) | 167.91 kcal (8%) | 0 g (0%) | 1.24 g (2%) | 36.65 g (65%) | |
| 52. Fish, cod, Pacific, cooked (not previously frozen) - Sodium |
| Nutritional Value : 15.00 / 100 food group - Finfish and Shellfish Products |
| Sodium | Potassium | Energy | Carbohydrate | Total Fat | Protein |
| Profile for a 100g serving : |
| 134.00 mg (8%) | 372.00 mg (8%) | 84.00 kcal (4%) | 0.00 g (0%) | 0.25 g (0%) | 20.42 g (36%) | |
| Typical Serving size of 3.000 oz (or 85.00g): |
| 113.9 mg (7%) | 316.2 mg (7%) | 71.4 kcal (4%) | 0 g (0%) | 0.21 g (0%) | 17.36 g (31%) | |
| 53. Fish, whiting, mixed species, cooked, dry heat - Sodium |
| Nutritional Value : 16.00 / 100 food group - Finfish and Shellfish Products |
| Sodium | Potassium | Energy | Carbohydrate | Total Fat | Protein |
| Profile for a 100g serving : |
| 132.00 mg (8%) | 434.00 mg (9%) | 116.00 kcal (6%) | 0.00 g (0%) | 1.69 g (3%) | 23.48 g (42%) | |
| Typical Serving size of 1.000 fillet (or 72.00g): |
| 95.04 mg (6%) | 312.48 mg (7%) | 83.52 kcal (4%) | 0 g (0%) | 1.22 g (2%) | 16.91 g (30%) | |
| Other serving sizes 3.000 oz (or 85.00g): |
| 112.2 mg (7%) | 368.9 mg (8%) | 98.6 kcal (5%) | 0 g (0%) | 1.44 g (2%) | 19.96 g (36%) | |
| 54. Fish, burbot, cooked, dry heat - Sodium |
| Nutritional Value : 15.00 / 100 food group - Finfish and Shellfish Products |
| Sodium | Potassium | Energy | Carbohydrate | Total Fat | Protein |
| Profile for a 100g serving : |
| 124.00 mg (8%) | 518.00 mg (11%) | 115.00 kcal (6%) | 0.00 g (0%) | 1.04 g (2%) | 24.76 g (44%) | |
| Typical Serving size of 1.000 fillet (or 90.00g): |
| 111.6 mg (7%) | 466.2 mg (10%) | 103.5 kcal (5%) | 0 g (0%) | 0.94 g (1%) | 22.28 g (40%) | |
| Other serving sizes 3.000 oz (or 85.00g): |
| 105.4 mg (7%) | 440.3 mg (9%) | 97.75 kcal (5%) | 0 g (0%) | 0.88 g (1%) | 21.05 g (38%) | |
| 55. Fish, shark, mixed species, cooked, batter-dipped and fried - Sodium |
| Nutritional Value : 14.00 / 100 food group - Finfish and Shellfish Products |
| Sodium | Potassium | Energy | Carbohydrate | Total Fat | Protein |
| Profile for a 100g serving : |
| 122.00 mg (8%) | 155.00 mg (3%) | 228.00 kcal (11%) | 6.39 g (5%) | 13.82 g (21%) | 18.62 g (33%) | |
| Typical Serving size of 3.000 oz (or 85.00g): |
| 103.7 mg (6%) | 131.75 mg (3%) | 193.8 kcal (10%) | 5.43 g (4%) | 11.75 g (18%) | 15.83 g (28%) | |
| 56. Fish, catfish, channel, farmed, cooked, dry heat - Sodium |
| Nutritional Value : 15.00 / 100 food group - Finfish and Shellfish Products |
| Sodium | Potassium | Energy | Carbohydrate | Total Fat | Protein |
| Profile for a 100g serving : |
| 119.00 mg (7%) | 366.00 mg (8%) | 144.00 kcal (7%) | 0.00 g (0%) | 7.19 g (11%) | 18.44 g (33%) | |
| Typical Serving size of 1.000 fillet (or 143.00g): |
| 170.17 mg (11%) | 523.38 mg (11%) | 205.92 kcal (10%) | 0 g (0%) | 10.28 g (16%) | 26.37 g (47%) | |
| Other serving sizes 3.000 oz (or 85.00g): |
| 101.15 mg (6%) | 311.1 mg (7%) | 122.4 kcal (6%) | 0 g (0%) | 6.11 g (9%) | 15.67 g (28%) | |
| 57. Fish, roe, mixed species, cooked, dry heat - Sodium |
| Nutritional Value : 15.00 / 100 food group - Finfish and Shellfish Products |
| Sodium | Potassium | Energy | Carbohydrate | Total Fat | Protein |
| Profile for a 100g serving : |
| 117.00 mg (7%) | 283.00 mg (6%) | 204.00 kcal (10%) | 1.92 g (1%) | 8.23 g (13%) | 28.62 g (51%) | |
| Typical Serving size of 1.000 oz (or 28.35g): |
| 33.17 mg (2%) | 80.23 mg (2%) | 57.83 kcal (3%) | 0.54 g (0%) | 2.33 g (4%) | 8.11 g (14%) | |
| Other serving sizes 3.000 oz (or 85.00g): |
| 99.45 mg (6%) | 240.55 mg (5%) | 173.4 kcal (9%) | 1.63 g (1%) | 7 g (11%) | 24.33 g (43%) | |
| 58. Fish, herring, Atlantic, cooked, dry heat - Sodium |
| Nutritional Value : 15.00 / 100 food group - Finfish and Shellfish Products |
| Sodium | Potassium | Energy | Carbohydrate | Total Fat | Protein |
| Profile for a 100g serving : |
| 115.00 mg (7%) | 419.00 mg (9%) | 203.00 kcal (10%) | 0.00 g (0%) | 11.59 g (18%) | 23.03 g (41%) | |
| Typical Serving size of 1.000 fillet (or 143.00g): |
| 164.45 mg (10%) | 599.17 mg (13%) | 290.29 kcal (15%) | 0 g (0%) | 16.57 g (25%) | 32.93 g (59%) | |
| Other serving sizes 3.000 oz (or 85.00g): |
| 97.75 mg (6%) | 356.15 mg (8%) | 172.55 kcal (9%) | 0 g (0%) | 9.85 g (15%) | 19.58 g (35%) | |
| 59. Fish, butterfish, cooked, dry heat - Sodium |
| Nutritional Value : 14.00 / 100 food group - Finfish and Shellfish Products |
| Sodium | Potassium | Energy | Carbohydrate | Total Fat | Protein |
| Profile for a 100g serving : |
| 114.00 mg (7%) | 481.00 mg (10%) | 187.00 kcal (9%) | 0.00 g (0%) | 10.28 g (16%) | 22.15 g (40%) | |
| Typical Serving size of 1.000 fillet (or 25.00g): |
| 28.5 mg (2%) | 120.25 mg (3%) | 46.75 kcal (2%) | 0 g (0%) | 2.57 g (4%) | 5.54 g (10%) | |
| Other serving sizes 3.000 oz (or 85.00g): |
| 96.9 mg (6%) | 408.85 mg (9%) | 158.95 kcal (8%) | 0 g (0%) | 8.74 g (13%) | 18.83 g (34%) | |
| 60. Fish, mahimahi, cooked, dry heat - Sodium |
| Nutritional Value : 15.00 / 100 food group - Finfish and Shellfish Products |
| Sodium | Potassium | Energy | Carbohydrate | Total Fat | Protein |
| Profile for a 100g serving : |
| 113.00 mg (7%) | 533.00 mg (11%) | 109.00 kcal (5%) | 0.00 g (0%) | 0.90 g (1%) | 23.72 g (42%) | |
| Typical Serving size of 3.000 oz (or 85.00g): |
| 96.05 mg (6%) | 453.05 mg (10%) | 92.65 kcal (5%) | 0 g (0%) | 0.77 g (1%) | 20.16 g (36%) | |
| Other serving sizes 1.000 fillet (or 159.00g): |
| 179.67 mg (11%) | 847.47 mg (18%) | 173.31 kcal (9%) | 0 g (0%) | 1.43 g (2%) | 37.71 g (67%) | |
| 61. Fish, mackerel, Pacific and jack, mixed species, cooked, dry heat - Sodium |
| Nutritional Value : 15.00 / 100 food group - Finfish and Shellfish Products |
| Sodium | Potassium | Energy | Carbohydrate | Total Fat | Protein |
| Profile for a 100g serving : |
| 110.00 mg (7%) | 521.00 mg (11%) | 201.00 kcal (10%) | 0.00 g (0%) | 10.12 g (16%) | 25.73 g (46%) | |
| Typical Serving size of 1.000 oz and boneless (or 28.35g): |
| 31.19 mg (2%) | 147.7 mg (3%) | 56.98 kcal (3%) | 0 g (0%) | 2.87 g (4%) | 7.29 g (13%) | |
| Other serving sizes 1.000 cubic inch and boneless (or 17.00g): |
| 18.7 mg (1%) | 88.57 mg (2%) | 34.17 kcal (2%) | 0 g (0%) | 1.72 g (3%) | 4.37 g (8%) | |
| Other serving sizes 1.000 fillet (or 176.00g): |
| 193.6 mg (12%) | 916.96 mg (20%) | 353.76 kcal (18%) | 0 g (0%) | 17.81 g (27%) | 45.28 g (81%) | |
| Other serving sizes 3.000 oz (or 85.00g): |
| 93.5 mg (6%) | 442.85 mg (9%) | 170.85 kcal (9%) | 0 g (0%) | 8.6 g (13%) | 21.87 g (39%) | |
| 62. Fish, pollock, Atlantic, cooked, dry heat - Sodium |
| Nutritional Value : 16.00 / 100 food group - Finfish and Shellfish Products |
| Sodium | Potassium | Energy | Carbohydrate | Total Fat | Protein |
| Profile for a 100g serving : |
| 110.00 mg (7%) | 456.00 mg (10%) | 118.00 kcal (6%) | 0.00 g (0%) | 1.26 g (2%) | 24.92 g (45%) | |
| Typical Serving size of 3.000 oz (or 85.00g): |
| 93.5 mg (6%) | 387.6 mg (8%) | 100.3 kcal (5%) | 0 g (0%) | 1.07 g (2%) | 21.18 g (38%) | |
| Other serving sizes 0.500 fillet (or 151.00g): |
| 166.1 mg (10%) | 688.56 mg (15%) | 178.18 kcal (9%) | 0 g (0%) | 1.9 g (3%) | 37.63 g (67%) | |
| 63. Fish, wolffish, Atlantic, cooked, dry heat - Sodium |
| Nutritional Value : 15.00 / 100 food group - Finfish and Shellfish Products |
| Sodium | Potassium | Energy | Carbohydrate | Total Fat | Protein |
| Profile for a 100g serving : |
| 109.00 mg (7%) | 385.00 mg (8%) | 123.00 kcal (6%) | 0.00 g (0%) | 3.06 g (5%) | 22.44 g (40%) | |
| Typical Serving size of 0.500 fillet (or 119.00g): |
| 129.71 mg (8%) | 458.15 mg (10%) | 146.37 kcal (7%) | 0 g (0%) | 3.64 g (6%) | 26.7 g (48%) | |
| Other serving sizes 3.000 oz (or 85.00g): |
| 92.65 mg (6%) | 327.25 mg (7%) | 104.55 kcal (5%) | 0 g (0%) | 2.6 g (4%) | 19.07 g (34%) | |
| 64. Fish, cod, Pacific, raw (not previously frozen) - Sodium |
| Nutritional Value : 15.00 / 100 food group - Finfish and Shellfish Products |
| Sodium | Potassium | Energy | Carbohydrate | Total Fat | Protein |
| Profile for a 100g serving : |
| 109.00 mg (7%) | 329.00 mg (7%) | 72.00 kcal (4%) | 0.00 g (0%) | 0.20 g (0%) | 17.54 g (31%) | |
| Typical Serving size of 3.000 oz (or 85.00g): |
| 92.65 mg (6%) | 279.65 mg (6%) | 61.2 kcal (3%) | 0 g (0%) | 0.17 g (0%) | 14.91 g (27%) | |
| 65. Fish, anchovy, european, raw - Sodium |
| Nutritional Value : 16.00 / 100 food group - Finfish and Shellfish Products |
| Sodium | Potassium | Energy | Carbohydrate | Total Fat | Protein |
| Profile for a 100g serving : |
| 104.00 mg (7%) | 383.00 mg (8%) | 131.00 kcal (7%) | 0.00 g (0%) | 4.84 g (7%) | 20.35 g (36%) | |
| Typical Serving size of 3.000 oz (or 85.00g): |
| 88.4 mg (6%) | 325.55 mg (7%) | 111.35 kcal (6%) | 0 g (0%) | 4.11 g (6%) | 17.3 g (31%) | |
| 66. Fish, halibut, greenland, cooked, dry heat - Sodium |
| Nutritional Value : 14.00 / 100 food group - Finfish and Shellfish Products |
| Sodium | Potassium | Energy | Carbohydrate | Total Fat | Protein |
| Profile for a 100g serving : |
| 103.00 mg (6%) | 344.00 mg (7%) | 239.00 kcal (12%) | 0.00 g (0%) | 17.74 g (27%) | 18.42 g (33%) | |
| Typical Serving size of 3.000 oz (or 85.00g): |
| 87.55 mg (5%) | 292.4 mg (6%) | 203.15 kcal (10%) | 0 g (0%) | 15.08 g (23%) | 15.66 g (28%) | |
| Other serving sizes 0.500 fillet (or 159.00g): |
| 163.77 mg (10%) | 546.96 mg (12%) | 380.01 kcal (19%) | 0 g (0%) | 28.21 g (43%) | 29.29 g (52%) | |
| 67. Fish, sunfish, pumpkin seed, cooked, dry heat - Sodium |
| Nutritional Value : 16.00 / 100 food group - Finfish and Shellfish Products |
| Sodium | Potassium | Energy | Carbohydrate | Total Fat | Protein |
| Profile for a 100g serving : |
| 103.00 mg (6%) | 449.00 mg (10%) | 114.00 kcal (6%) | 0.00 g (0%) | 0.90 g (1%) | 24.87 g (44%) | |
| Typical Serving size of 1.000 fillet (or 37.00g): |
| 38.11 mg (2%) | 166.13 mg (4%) | 42.18 kcal (2%) | 0 g (0%) | 0.33 g (1%) | 9.2 g (16%) | |
| Other serving sizes 3.000 oz (or 85.00g): |
| 87.55 mg (5%) | 381.65 mg (8%) | 96.9 kcal (5%) | 0 g (0%) | 0.77 g (1%) | 21.14 g (38%) | |
| 68. Fish, catfish, channel, farmed, raw - Sodium |
| Nutritional Value : 15.00 / 100 food group - Finfish and Shellfish Products |
| Sodium | Potassium | Energy | Carbohydrate | Total Fat | Protein |
| Profile for a 100g serving : |
| 98.00 mg (6%) | 302.00 mg (6%) | 119.00 kcal (6%) | 0.00 g (0%) | 5.94 g (9%) | 15.23 g (27%) | |
| Typical Serving size of 3.000 oz (or 85.00g): |
| 83.3 mg (5%) | 256.7 mg (5%) | 101.15 kcal (5%) | 0 g (0%) | 5.05 g (8%) | 12.95 g (23%) | |
| Other serving sizes 1.000 fillet (or 159.00g): |
| 155.82 mg (10%) | 480.18 mg (10%) | 189.21 kcal (9%) | 0 g (0%) | 9.44 g (15%) | 24.22 g (43%) | |
| 69. Fish, burbot, raw - Sodium |
| Nutritional Value : 15.00 / 100 food group - Finfish and Shellfish Products |
| Sodium | Potassium | Energy | Carbohydrate | Total Fat | Protein |
| Profile for a 100g serving : |
| 97.00 mg (6%) | 404.00 mg (9%) | 90.00 kcal (5%) | 0.00 g (0%) | 0.81 g (1%) | 19.31 g (34%) | |
| Typical Serving size of 1.000 fillet (or 116.00g): |
| 112.52 mg (7%) | 468.64 mg (10%) | 104.4 kcal (5%) | 0 g (0%) | 0.94 g (1%) | 22.4 g (40%) | |
| Other serving sizes 3.000 oz (or 85.00g): |
| 82.45 mg (5%) | 343.4 mg (7%) | 76.5 kcal (4%) | 0 g (0%) | 0.69 g (1%) | 16.41 g (29%) | |
| 70. Fish, swordfish, cooked, dry heat - Sodium |
| Nutritional Value : 15.00 / 100 food group - Finfish and Shellfish Products |
| Sodium | Potassium | Energy | Carbohydrate | Total Fat | Protein |
| Profile for a 100g serving : |
| 97.00 mg (6%) | 499.00 mg (11%) | 172.00 kcal (9%) | 0.00 g (0%) | 7.93 g (12%) | 23.45 g (42%) | |
| Typical Serving size of 3.000 oz (or 85.00g): |
| 82.45 mg (5%) | 424.15 mg (9%) | 146.2 kcal (7%) | 0 g (0%) | 6.74 g (10%) | 19.93 g (36%) | |
| Other serving sizes 1.000 piece (or 106.00g): |
| 102.82 mg (6%) | 528.94 mg (11%) | 182.32 kcal (9%) | 0 g (0%) | 8.41 g (13%) | 24.86 g (44%) | |
| 71. Fish, drum, freshwater, cooked, dry heat - Sodium |
| Nutritional Value : 15.00 / 100 food group - Finfish and Shellfish Products |
| Sodium | Potassium | Energy | Carbohydrate | Total Fat | Protein |
| Profile for a 100g serving : |
| 96.00 mg (6%) | 353.00 mg (8%) | 153.00 kcal (8%) | 0.00 g (0%) | 6.32 g (10%) | 22.49 g (40%) | |
| Typical Serving size of 3.000 oz (or 85.00g): |
| 81.6 mg (5%) | 300.05 mg (6%) | 130.05 kcal (7%) | 0 g (0%) | 5.37 g (8%) | 19.12 g (34%) | |
| Other serving sizes 1.000 fillet (or 154.00g): |
| 147.84 mg (9%) | 543.62 mg (12%) | 235.62 kcal (12%) | 0 g (0%) | 9.73 g (15%) | 34.63 g (62%) | |
| 72. Fish, herring, Pacific, cooked, dry heat - Sodium |
| Nutritional Value : 14.00 / 100 food group - Finfish and Shellfish Products |
| Sodium | Potassium | Energy | Carbohydrate | Total Fat | Protein |
| Profile for a 100g serving : |
| 95.00 mg (6%) | 542.00 mg (12%) | 250.00 kcal (13%) | 0.00 g (0%) | 17.79 g (27%) | 21.01 g (38%) | |
| Typical Serving size of 1.000 fillet (or 144.00g): |
| 136.8 mg (9%) | 780.48 mg (17%) | 360 kcal (18%) | 0 g (0%) | 25.62 g (39%) | 30.25 g (54%) | |
| Other serving sizes 3.000 oz (or 85.00g): |
| 80.75 mg (5%) | 460.7 mg (10%) | 212.5 kcal (11%) | 0 g (0%) | 15.12 g (23%) | 17.86 g (32%) | |
| 73. Fish, salmon, sockeye, cooked, dry heat - Sodium |
| Nutritional Value : 15.00 / 100 food group - Finfish and Shellfish Products |
| Sodium | Potassium | Energy | Carbohydrate | Total Fat | Protein |
| Profile for a 100g serving : |
| 92.00 mg (6%) | 436.00 mg (9%) | 156.00 kcal (8%) | 0.00 g (0%) | 5.57 g (9%) | 26.48 g (47%) | |
| Typical Serving size of 3.000 oz (or 85.00g): |
| 78.2 mg (5%) | 370.6 mg (8%) | 132.6 kcal (7%) | 0 g (0%) | 4.73 g (7%) | 22.51 g (40%) | |
| Other serving sizes 0.500 fillet (or 155.00g): |
| 142.6 mg (9%) | 675.8 mg (14%) | 241.8 kcal (12%) | 0 g (0%) | 8.63 g (13%) | 41.04 g (73%) | |
| 74. Fish, milkfish, cooked, dry heat - Sodium |
| Nutritional Value : 15.00 / 100 food group - Finfish and Shellfish Products |
| Sodium | Potassium | Energy | Carbohydrate | Total Fat | Protein |
| Profile for a 100g serving : |
| 92.00 mg (6%) | 374.00 mg (8%) | 190.00 kcal (10%) | 0.00 g (0%) | 8.63 g (13%) | 26.32 g (47%) | |
| Typical Serving size of 3.000 oz (or 85.00g): |
| 78.2 mg (5%) | 317.9 mg (7%) | 161.5 kcal (8%) | 0 g (0%) | 7.34 g (11%) | 22.37 g (40%) | |
| 75. Fish, roe, mixed species, raw - Sodium |
| Nutritional Value : 17.00 / 100 food group - Finfish and Shellfish Products |
| Sodium | Potassium | Energy | Carbohydrate | Total Fat | Protein |
| Profile for a 100g serving : |
| 91.00 mg (6%) | 221.00 mg (5%) | 143.00 kcal (7%) | 1.50 g (1%) | 6.42 g (10%) | 22.32 g (40%) | |
| Typical Serving size of 1.000 tbsp (or 14.00g): |
| 12.74 mg (1%) | 30.94 mg (1%) | 20.02 kcal (1%) | 0.21 g (0%) | 0.9 g (1%) | 3.12 g (6%) | |
| Other serving sizes 1.000 oz (or 28.35g): |
| 25.8 mg (2%) | 62.65 mg (1%) | 40.54 kcal (2%) | 0.43 g (0%) | 1.82 g (3%) | 6.33 g (11%) | |
| Other serving sizes 1.000 can (8 oz) and solids and liquid (or 227.00g): |
| 206.57 mg (13%) | 501.67 mg (11%) | 324.61 kcal (16%) | 3.41 g (3%) | 14.57 g (22%) | 50.67 g (90%) | |
| Other serving sizes 3.000 oz (or 85.00g): |
| 77.35 mg (5%) | 187.85 mg (4%) | 121.55 kcal (6%) | 1.28 g (1%) | 5.46 g (8%) | 18.97 g (34%) | |
| 76. Fish, herring, Atlantic, raw - Sodium |
| Nutritional Value : 15.00 / 100 food group - Finfish and Shellfish Products |
| Sodium | Potassium | Energy | Carbohydrate | Total Fat | Protein |
| Profile for a 100g serving : |
| 90.00 mg (6%) | 327.00 mg (7%) | 158.00 kcal (8%) | 0.00 g (0%) | 9.04 g (14%) | 17.96 g (32%) | |
| Typical Serving size of 1.000 oz and boneless (or 28.35g): |
| 25.52 mg (2%) | 92.7 mg (2%) | 44.79 kcal (2%) | 0 g (0%) | 2.56 g (4%) | 5.09 g (9%) | |
| Other serving sizes 1.000 fillet (or 184.00g): |
| 165.6 mg (10%) | 601.68 mg (13%) | 290.72 kcal (15%) | 0 g (0%) | 16.63 g (26%) | 33.05 g (59%) | |
| Other serving sizes 3.000 oz (or 85.00g): |
| 76.5 mg (5%) | 277.95 mg (6%) | 134.3 kcal (7%) | 0 g (0%) | 7.68 g (12%) | 15.27 g (27%) | |
| 77. Fish, mackerel, Atlantic, raw - Sodium |
| Nutritional Value : 15.00 / 100 food group - Finfish and Shellfish Products |
| Sodium | Potassium | Energy | Carbohydrate | Total Fat | Protein |
| Profile for a 100g serving : |
| 90.00 mg (6%) | 314.00 mg (7%) | 205.00 kcal (10%) | 0.00 g (0%) | 13.89 g (21%) | 18.60 g (33%) | |
| Typical Serving size of 1.000 fillet (or 112.00g): |
| 100.8 mg (6%) | 351.68 mg (7%) | 229.6 kcal (11%) | 0 g (0%) | 15.56 g (24%) | 20.83 g (37%) | |
| Other serving sizes 3.000 oz (or 85.00g): |
| 76.5 mg (5%) | 266.9 mg (6%) | 174.25 kcal (9%) | 0 g (0%) | 11.81 g (18%) | 15.81 g (28%) | |
| 78. Fish, salmon, pink, cooked, dry heat - Sodium |
| Nutritional Value : 15.00 / 100 food group - Finfish and Shellfish Products |
| Sodium | Potassium | Energy | Carbohydrate | Total Fat | Protein |
| Profile for a 100g serving : |
| 90.00 mg (6%) | 439.00 mg (9%) | 153.00 kcal (8%) | 0.00 g (0%) | 5.28 g (8%) | 24.58 g (44%) | |
| Typical Serving size of 3.000 oz (or 85.00g): |
| 76.5 mg (5%) | 373.15 mg (8%) | 130.05 kcal (7%) | 0 g (0%) | 4.49 g (7%) | 20.89 g (37%) | |
| Other serving sizes 0.500 fillet (or 124.00g): |
| 111.6 mg (7%) | 544.36 mg (12%) | 189.72 kcal (9%) | 0 g (0%) | 6.55 g (10%) | 30.48 g (54%) | |
| 79. Fish, bass, freshwater, mixed species, cooked, dry heat - Sodium |
| Nutritional Value : 16.00 / 100 food group - Finfish and Shellfish Products |
| Sodium | Potassium | Energy | Carbohydrate | Total Fat | Protein |
| Profile for a 100g serving : |
| 90.00 mg (6%) | 456.00 mg (10%) | 146.00 kcal (7%) | 0.00 g (0%) | 4.73 g (7%) | 24.18 g (43%) | |
| Typical Serving size of 1.000 fillet (or 62.00g): |
| 55.8 mg (3%) | 282.72 mg (6%) | 90.52 kcal (5%) | 0 g (0%) | 2.93 g (5%) | 14.99 g (27%) | |
| Other serving sizes 3.000 oz (or 85.00g): |
| 76.5 mg (5%) | 387.6 mg (8%) | 124.1 kcal (6%) | 0 g (0%) | 4.02 g (6%) | 20.55 g (37%) | |
| 80. Fish, butterfish, raw - Sodium |
| Nutritional Value : 14.00 / 100 food group - Finfish and Shellfish Products |
| Sodium | Potassium | Energy | Carbohydrate | Total Fat | Protein |
| Profile for a 100g serving : |
| 89.00 mg (6%) | 375.00 mg (8%) | 146.00 kcal (7%) | 0.00 g (0%) | 8.02 g (12%) | 17.28 g (31%) | |
| Typical Serving size of 1.000 fillet (or 32.00g): |
| 28.48 mg (2%) | 120 mg (3%) | 46.72 kcal (2%) | 0 g (0%) | 2.57 g (4%) | 5.53 g (10%) | |
| Other serving sizes 3.000 oz (or 85.00g): |
| 75.65 mg (5%) | 318.75 mg (7%) | 124.1 kcal (6%) | 0 g (0%) | 6.82 g (10%) | 14.69 g (26%) | |
| 81. Fish, rockfish, Pacific, mixed species, cooked, dry heat - Sodium |
| Nutritional Value : 16.00 / 100 food group - Finfish and Shellfish Products |
| Sodium | Potassium | Energy | Carbohydrate | Total Fat | Protein |
| Profile for a 100g serving : |
| 89.00 mg (6%) | 467.00 mg (10%) | 109.00 kcal (5%) | 0.00 g (0%) | 1.62 g (2%) | 22.23 g (40%) | |
| Typical Serving size of 1.000 fillet (or 149.00g): |
| 132.61 mg (8%) | 695.83 mg (15%) | 162.41 kcal (8%) | 0 g (0%) | 2.41 g (4%) | 33.12 g (59%) | |
| Other serving sizes 3.000 oz (or 85.00g): |
| 75.65 mg (5%) | 396.95 mg (8%) | 92.65 kcal (5%) | 0 g (0%) | 1.38 g (2%) | 18.9 g (34%) | |
| 82. Fish, mahimahi, raw - Sodium |
| Nutritional Value : 16.00 / 100 food group - Finfish and Shellfish Products |
| Sodium | Potassium | Energy | Carbohydrate | Total Fat | Protein |
| Profile for a 100g serving : |
| 88.00 mg (6%) | 416.00 mg (9%) | 85.00 kcal (4%) | 0.00 g (0%) | 0.70 g (1%) | 18.50 g (33%) | |
| Typical Serving size of 3.000 oz (or 85.00g): |
| 74.8 mg (5%) | 353.6 mg (8%) | 72.25 kcal (4%) | 0 g (0%) | 0.6 g (1%) | 15.73 g (28%) | |
| Other serving sizes 1.000 fillet (or 204.00g): |
| 179.52 mg (11%) | 848.64 mg (18%) | 173.4 kcal (9%) | 0 g (0%) | 1.43 g (2%) | 37.74 g (67%) | |
| 83. Fish, bass, striped, cooked, dry heat - Sodium |
| Nutritional Value : 15.00 / 100 food group - Finfish and Shellfish Products |
| Sodium | Potassium | Energy | Carbohydrate | Total Fat | Protein |
| Profile for a 100g serving : |
| 88.00 mg (6%) | 328.00 mg (7%) | 124.00 kcal (6%) | 0.00 g (0%) | 2.99 g (5%) | 22.73 g (41%) | |
| Typical Serving size of 1.000 fillet (or 124.00g): |
| 109.12 mg (7%) | 406.72 mg (9%) | 153.76 kcal (8%) | 0 g (0%) | 3.71 g (6%) | 28.19 g (50%) | |
| Other serving sizes 3.000 oz (or 85.00g): |
| 74.8 mg (5%) | 278.8 mg (6%) | 105.4 kcal (5%) | 0 g (0%) | 2.54 g (4%) | 19.32 g (35%) | |
| 84. Fish, sea bass, mixed species, cooked, dry heat - Sodium |
| Nutritional Value : 15.00 / 100 food group - Finfish and Shellfish Products |
| Sodium | Potassium | Energy | Carbohydrate | Total Fat | Protein |
| Profile for a 100g serving : |
| 87.00 mg (5%) | 328.00 mg (7%) | 124.00 kcal (6%) | 0.00 g (0%) | 2.56 g (4%) | 23.63 g (42%) | |
| Typical Serving size of 1.000 fillet (or 101.00g): |
| 87.87 mg (5%) | 331.28 mg (7%) | 125.24 kcal (6%) | 0 g (0%) | 2.59 g (4%) | 23.87 g (43%) | |
| Other serving sizes 3.000 oz (or 85.00g): |
| 73.95 mg (5%) | 278.8 mg (6%) | 105.4 kcal (5%) | 0 g (0%) | 2.18 g (3%) | 20.09 g (36%) | |
| 85. Fish, mackerel, Pacific and jack, mixed species, raw - Sodium |
| Nutritional Value : 15.00 / 100 food group - Finfish and Shellfish Products |
| Sodium | Potassium | Energy | Carbohydrate | Total Fat | Protein |
| Profile for a 100g serving : |
| 86.00 mg (5%) | 406.00 mg (9%) | 158.00 kcal (8%) | 0.00 g (0%) | 7.89 g (12%) | 20.07 g (36%) | |
| Typical Serving size of 3.000 oz (or 85.00g): |
| 73.1 mg (5%) | 345.1 mg (7%) | 134.3 kcal (7%) | 0 g (0%) | 6.71 g (10%) | 17.06 g (30%) | |
| Other serving sizes 1.000 fillet (or 225.00g): |
| 193.5 mg (12%) | 913.5 mg (19%) | 355.5 kcal (18%) | 0 g (0%) | 17.75 g (27%) | 45.16 g (81%) | |
| 86. Fish, pollock, Atlantic, raw - Sodium |
| Nutritional Value : 16.00 / 100 food group - Finfish and Shellfish Products |
| Sodium | Potassium | Energy | Carbohydrate | Total Fat | Protein |
| Profile for a 100g serving : |
| 86.00 mg (5%) | 356.00 mg (8%) | 92.00 kcal (5%) | 0.00 g (0%) | 0.98 g (2%) | 19.44 g (35%) | |
| Typical Serving size of 3.000 oz (or 85.00g): |
| 73.1 mg (5%) | 302.6 mg (6%) | 78.2 kcal (4%) | 0 g (0%) | 0.83 g (1%) | 16.52 g (30%) | |
| Other serving sizes 0.500 fillet (or 193.00g): |
| 165.98 mg (10%) | 687.08 mg (15%) | 177.56 kcal (9%) | 0 g (0%) | 1.89 g (3%) | 37.52 g (67%) | |
| 87. Fish, wolffish, Atlantic, raw - Sodium |
| Nutritional Value : 15.00 / 100 food group - Finfish and Shellfish Products |
| Sodium | Potassium | Energy | Carbohydrate | Total Fat | Protein |
| Profile for a 100g serving : |
| 85.00 mg (5%) | 300.00 mg (6%) | 96.00 kcal (5%) | 0.00 g (0%) | 2.39 g (4%) | 17.50 g (31%) | |
| Typical Serving size of 3.000 oz (or 85.00g): |
| 72.25 mg (5%) | 255 mg (5%) | 81.6 kcal (4%) | 0 g (0%) | 2.03 g (3%) | 14.88 g (27%) | |
| Other serving sizes 0.500 fillet (or 153.00g): |
| 130.05 mg (8%) | 459 mg (10%) | 146.88 kcal (7%) | 0 g (0%) | 3.66 g (6%) | 26.78 g (48%) | |
| 88. Fish, mackerel, Atlantic, cooked, dry heat - Sodium |
| Nutritional Value : 15.00 / 100 food group - Finfish and Shellfish Products |
| Sodium | Potassium | Energy | Carbohydrate | Total Fat | Protein |
| Profile for a 100g serving : |
| 83.00 mg (5%) | 401.00 mg (9%) | 262.00 kcal (13%) | 0.00 g (0%) | 17.81 g (27%) | 23.85 g (43%) | |
| Typical Serving size of 1.000 fillet (or 88.00g): |
| 73.04 mg (5%) | 352.88 mg (8%) | 230.56 kcal (12%) | 0 g (0%) | 15.67 g (24%) | 20.99 g (37%) | |
| Other serving sizes 3.000 oz (or 85.00g): |
| 70.55 mg (4%) | 340.85 mg (7%) | 222.7 kcal (11%) | 0 g (0%) | 15.14 g (23%) | 20.27 g (36%) | |
| 89. Fish, halibut, Atlantic and Pacific, cooked, dry heat - Sodium |
| Nutritional Value : 16.00 / 100 food group - Finfish and Shellfish Products |
| Sodium | Potassium | Energy | Carbohydrate | Total Fat | Protein |
| Profile for a 100g serving : |
| 82.00 mg (5%) | 528.00 mg (11%) | 111.00 kcal (6%) | 0.00 g (0%) | 1.61 g (2%) | 22.54 g (40%) | |
| Typical Serving size of 3.000 oz (or 85.00g): |
| 69.7 mg (4%) | 448.8 mg (10%) | 94.35 kcal (5%) | 0 g (0%) | 1.37 g (2%) | 19.16 g (34%) | |
| Other serving sizes 0.500 fillet (or 159.00g): |
| 130.38 mg (8%) | 839.52 mg (18%) | 176.49 kcal (9%) | 0 g (0%) | 2.56 g (4%) | 35.84 g (64%) | |
| 90. Fish, swordfish, raw - Sodium |
| Nutritional Value : 15.00 / 100 food group - Finfish and Shellfish Products |
| Sodium | Potassium | Energy | Carbohydrate | Total Fat | Protein |
| Profile for a 100g serving : |
| 81.00 mg (5%) | 418.00 mg (9%) | 144.00 kcal (7%) | 0.00 g (0%) | 6.65 g (10%) | 19.66 g (35%) | |
| Typical Serving size of 3.000 oz (or 85.00g): |
| 68.85 mg (4%) | 355.3 mg (8%) | 122.4 kcal (6%) | 0 g (0%) | 5.65 g (9%) | 16.71 g (30%) | |
| Other serving sizes 1.000 piece (4-1/2" x 2-1/8" x 7/8") (or 136.00g): |
| 110.16 mg (7%) | 568.48 mg (12%) | 195.84 kcal (10%) | 0 g (0%) | 9.04 g (14%) | 26.74 g (48%) | |
| 91. Fish, halibut, Greenland, raw - Sodium |
| Nutritional Value : 14.00 / 100 food group - Finfish and Shellfish Products |
| Sodium | Potassium | Energy | Carbohydrate | Total Fat | Protein |
| Profile for a 100g serving : |
| 80.00 mg (5%) | 268.00 mg (6%) | 186.00 kcal (9%) | 0.00 g (0%) | 13.84 g (21%) | 14.37 g (26%) | |
| Typical Serving size of 3.000 oz (or 85.00g): |
| 68 mg (4%) | 227.8 mg (5%) | 158.1 kcal (8%) | 0 g (0%) | 11.76 g (18%) | 12.21 g (22%) | |