Fish List, niacin Content per 100g
|
|
|
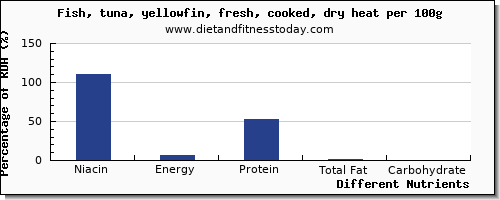
| 1. Fish, tuna, yellowfin, fresh, cooked, dry heat - Niacin |
| Nutritional Value : 16.00 / 100 food group - Finfish and Shellfish Products |
Niacin
(%RDA) | Energy
(%RDA) | Carbohydrate
(%RDA) | Total Fat
(%RDA) | Protein
(%RDA) |
| Profile for a 100g serving : |
| 22.07 mg (110%) | 130.00 kcal (7%) | 0.00 g (0%) | 0.59 g (1%) | 29.15 g (52%) | |
| Typical Serving size of 3.000 oz (or 85.00g): |
| 18.76 mg (94%) | 110.5 kcal (6%) | 0 g (0%) | 0.5 g (1%) | 24.78 g (44%) | |
| 2. Fish, anchovy, european, canned in oil, drained solids - Niacin |
| Nutritional Value : 15.00 / 100 food group - Finfish and Shellfish Products |
| Niacin | Energy | Carbohydrate | Total Fat | Protein |
| Profile for a 100g serving : |
| 19.90 mg (100%) | 210.00 kcal (11%) | 0.00 g (0%) | 9.71 g (15%) | 28.89 g (52%) | |
| Typical Serving size of 1.000 oz and boneless (or 28.35g): |
| 5.64 mg (28%) | 59.54 kcal (3%) | 0 g (0%) | 2.75 g (4%) | 8.19 g (15%) | |
| Other serving sizes 1.000 anchovy (or 4.00g): |
| 0.8 mg (4%) | 8.4 kcal (0%) | 0 g (0%) | 0.39 g (1%) | 1.16 g (2%) | |
| Other serving sizes 1.000 can (2 oz) (or 45.00g): |
| 8.96 mg (45%) | 94.5 kcal (5%) | 0 g (0%) | 4.37 g (7%) | 13 g (23%) | |
| Other serving sizes 5.000 anchovies (or 20.00g): |
| 3.98 mg (20%) | 42 kcal (2%) | 0 g (0%) | 1.94 g (3%) | 5.78 g (10%) | |
| 3. Fish, tuna, skipjack, fresh, cooked, dry heat - Niacin |
| Nutritional Value : 16.00 / 100 food group - Finfish and Shellfish Products |
| Niacin | Energy | Carbohydrate | Total Fat | Protein |
| Profile for a 100g serving : |
| 18.76 mg (94%) | 132.00 kcal (7%) | 0.00 g (0%) | 1.29 g (2%) | 28.21 g (50%) | |
| Typical Serving size of 3.000 oz (or 85.00g): |
| 15.95 mg (80%) | 112.2 kcal (6%) | 0 g (0%) | 1.1 g (2%) | 23.98 g (43%) | |
| Other serving sizes 0.500 fillet (or 154.00g): |
| 28.89 mg (144%) | 203.28 kcal (10%) | 0 g (0%) | 1.99 g (3%) | 43.44 g (78%) | |
| 4. Fish, tuna, fresh, yellowfin, raw - Niacin |
| Nutritional Value : 16.00 / 100 food group - Finfish and Shellfish Products |
| Niacin | Energy | Carbohydrate | Total Fat | Protein |
| Profile for a 100g serving : |
| 18.48 mg (92%) | 109.00 kcal (5%) | 0.00 g (0%) | 0.49 g (1%) | 24.40 g (44%) | |
| Typical Serving size of 1.000 oz and boneless (or 28.35g): |
| 5.24 mg (26%) | 30.9 kcal (2%) | 0 g (0%) | 0.14 g (0%) | 6.92 g (12%) | |
| Other serving sizes 1.000 cubic inch and boneless (or 16.00g): |
| 2.96 mg (15%) | 17.44 kcal (1%) | 0 g (0%) | 0.08 g (0%) | 3.9 g (7%) | |
| Other serving sizes 3.000 oz (or 85.00g): |
| 15.71 mg (79%) | 92.65 kcal (5%) | 0 g (0%) | 0.42 g (1%) | 20.74 g (37%) | |
| 5. Fish, tuna, fresh, skipjack, raw - Niacin |
| Nutritional Value : 16.00 / 100 food group - Finfish and Shellfish Products |
| Niacin | Energy | Carbohydrate | Total Fat | Protein |
| Profile for a 100g serving : |
| 15.40 mg (77%) | 103.00 kcal (5%) | 0.00 g (0%) | 1.01 g (2%) | 22.00 g (39%) | |
| Typical Serving size of 3.000 oz (or 85.00g): |
| 13.09 mg (65%) | 87.55 kcal (4%) | 0 g (0%) | 0.86 g (1%) | 18.7 g (33%) | |
| Other serving sizes 0.500 fillet (or 198.00g): |
| 30.49 mg (152%) | 203.94 kcal (10%) | 0 g (0%) | 2 g (3%) | 43.56 g (78%) | |
| 6. Fish, anchovy, european, raw - Niacin |
| Nutritional Value : 16.00 / 100 food group - Finfish and Shellfish Products |
| Niacin | Energy | Carbohydrate | Total Fat | Protein |
| Profile for a 100g serving : |
| 14.02 mg (70%) | 131.00 kcal (7%) | 0.00 g (0%) | 4.84 g (7%) | 20.35 g (36%) | |
| Typical Serving size of 3.000 oz (or 85.00g): |
| 11.92 mg (60%) | 111.35 kcal (6%) | 0 g (0%) | 4.11 g (6%) | 17.3 g (31%) | |
| 7. Fish, tuna, light, canned in water, without salt, drained solids - Niacin |
| Nutritional Value : 15.00 / 100 food group - Finfish and Shellfish Products |
| Niacin | Energy | Carbohydrate | Total Fat | Protein |
| Profile for a 100g serving : |
| 13.28 mg (66%) | 116.00 kcal (6%) | 0.00 g (0%) | 0.82 g (1%) | 25.51 g (46%) | |
| Typical Serving size of 3.000 oz (or 85.00g): |
| 11.29 mg (56%) | 98.6 kcal (5%) | 0 g (0%) | 0.7 g (1%) | 21.68 g (39%) | |
| Other serving sizes 1.000 can (or 165.00g): |
| 21.91 mg (110%) | 191.4 kcal (10%) | 0 g (0%) | 1.35 g (2%) | 42.09 g (75%) | |
| 8. Fish, tuna, light, canned in oil, drained solids - Niacin |
| Nutritional Value : 15.00 / 100 food group - Finfish and Shellfish Products |
| Niacin | Energy | Carbohydrate | Total Fat | Protein |
| Profile for a 100g serving : |
| 12.40 mg (62%) | 198.00 kcal (10%) | 0.00 g (0%) | 8.21 g (13%) | 29.13 g (52%) | |
| Typical Serving size of 1.000 cup and solid or chunks (or 146.00g): |
| 18.1 mg (91%) | 289.08 kcal (14%) | 0 g (0%) | 11.99 g (18%) | 42.53 g (76%) | |
| Other serving sizes 1.000 oz (or 28.35g): |
| 3.52 mg (18%) | 56.13 kcal (3%) | 0 g (0%) | 2.33 g (4%) | 8.26 g (15%) | |
| Other serving sizes 1.000 can (or 171.00g): |
| 21.2 mg (106%) | 338.58 kcal (17%) | 0 g (0%) | 14.04 g (22%) | 49.81 g (89%) | |
| Other serving sizes 3.000 oz (or 85.00g): |
| 10.54 mg (53%) | 168.3 kcal (8%) | 0 g (0%) | 6.98 g (11%) | 24.76 g (44%) | |
| Other serving sizes 1.000 can (12.5 oz) and drained (or 321.00g): |
| 39.8 mg (199%) | 635.58 kcal (32%) | 0 g (0%) | 26.35 g (41%) | 93.51 g (167%) | |
| 9. Fish, tuna, light, canned in oil, without salt, drained solids - Niacin |
| Nutritional Value : 14.00 / 100 food group - Finfish and Shellfish Products |
| Niacin | Energy | Carbohydrate | Total Fat | Protein |
| Profile for a 100g serving : |
| 12.40 mg (62%) | 198.00 kcal (10%) | 0.00 g (0%) | 8.21 g (13%) | 29.13 g (52%) | |
| Typical Serving size of 3.000 oz (or 85.00g): |
| 10.54 mg (53%) | 168.3 kcal (8%) | 0 g (0%) | 6.98 g (11%) | 24.76 g (44%) | |
| Other serving sizes 1.000 can (or 171.00g): |
| 21.2 mg (106%) | 338.58 kcal (17%) | 0 g (0%) | 14.04 g (22%) | 49.81 g (89%) | |
| 10. Fish, tuna, white, canned in oil, without salt, drained solids - Niacin |
| Nutritional Value : 14.00 / 100 food group - Finfish and Shellfish Products |
| Niacin | Energy | Carbohydrate | Total Fat | Protein |
| Profile for a 100g serving : |
| 11.70 mg (59%) | 186.00 kcal (9%) | 0.00 g (0%) | 8.08 g (12%) | 26.53 g (47%) | |
| Typical Serving size of 3.000 oz (or 85.00g): |
| 9.95 mg (50%) | 158.1 kcal (8%) | 0 g (0%) | 6.87 g (11%) | 22.55 g (40%) | |
| Other serving sizes 1.000 can (or 178.00g): |
| 20.83 mg (104%) | 331.08 kcal (17%) | 0 g (0%) | 14.38 g (22%) | 47.22 g (84%) | |
| 11. Fish, tuna, white, canned in oil, drained solids - Niacin |
| Nutritional Value : 15.00 / 100 food group - Finfish and Shellfish Products |
| Niacin | Energy | Carbohydrate | Total Fat | Protein |
| Profile for a 100g serving : |
| 11.70 mg (59%) | 186.00 kcal (9%) | 0.00 g (0%) | 8.08 g (12%) | 26.53 g (47%) | |
| Typical Serving size of 3.000 oz (or 85.00g): |
| 9.95 mg (50%) | 158.1 kcal (8%) | 0 g (0%) | 6.87 g (11%) | 22.55 g (40%) | |
| Other serving sizes 1.000 can (or 178.00g): |
| 20.83 mg (104%) | 331.08 kcal (17%) | 0 g (0%) | 14.38 g (22%) | 47.22 g (84%) | |
| 12. Fish, sturgeon, mixed species, smoked - Niacin |
| Nutritional Value : 15.00 / 100 food group - Finfish and Shellfish Products |
| Niacin | Energy | Carbohydrate | Total Fat | Protein |
| Profile for a 100g serving : |
| 11.10 mg (56%) | 173.00 kcal (9%) | 0.00 g (0%) | 4.40 g (7%) | 31.20 g (56%) | |
| Typical Serving size of 1.000 oz (or 28.35g): |
| 3.15 mg (16%) | 49.05 kcal (2%) | 0 g (0%) | 1.25 g (2%) | 8.85 g (16%) | |
| Other serving sizes 3.000 oz (or 85.00g): |
| 9.44 mg (47%) | 147.05 kcal (7%) | 0 g (0%) | 3.74 g (6%) | 26.52 g (47%) | |
| 13. Fish, shad, american, cooked, dry heat - Niacin |
| Nutritional Value : 14.00 / 100 food group - Finfish and Shellfish Products |
| Niacin | Energy | Carbohydrate | Total Fat | Protein |
| Profile for a 100g serving : |
| 10.77 mg (54%) | 252.00 kcal (13%) | 0.00 g (0%) | 17.65 g (27%) | 21.71 g (39%) | |
| Typical Serving size of 1.000 fillet (or 144.00g): |
| 15.51 mg (78%) | 362.88 kcal (18%) | 0 g (0%) | 25.42 g (39%) | 31.26 g (56%) | |
| Other serving sizes 3.000 oz (or 85.00g): |
| 9.15 mg (46%) | 214.2 kcal (11%) | 0 g (0%) | 15 g (23%) | 18.45 g (33%) | |
| 14. Fish, mackerel, Pacific and jack, mixed species, cooked, dry heat - Niacin |
| Nutritional Value : 15.00 / 100 food group - Finfish and Shellfish Products |
| Niacin | Energy | Carbohydrate | Total Fat | Protein |
| Profile for a 100g serving : |
| 10.67 mg (53%) | 201.00 kcal (10%) | 0.00 g (0%) | 10.12 g (16%) | 25.73 g (46%) | |
| Typical Serving size of 1.000 oz and boneless (or 28.35g): |
| 3.02 mg (15%) | 56.98 kcal (3%) | 0 g (0%) | 2.87 g (4%) | 7.29 g (13%) | |
| Other serving sizes 1.000 cubic inch and boneless (or 17.00g): |
| 1.81 mg (9%) | 34.17 kcal (2%) | 0 g (0%) | 1.72 g (3%) | 4.37 g (8%) | |
| Other serving sizes 1.000 fillet (or 176.00g): |
| 18.78 mg (94%) | 353.76 kcal (18%) | 0 g (0%) | 17.81 g (27%) | 45.28 g (81%) | |
| Other serving sizes 3.000 oz (or 85.00g): |
| 9.07 mg (45%) | 170.85 kcal (9%) | 0 g (0%) | 8.6 g (13%) | 21.87 g (39%) | |
| 15. Fish, tuna, fresh, bluefin, cooked, dry heat - Niacin |
| Nutritional Value : 15.00 / 100 food group - Finfish and Shellfish Products |
| Niacin | Energy | Carbohydrate | Total Fat | Protein |
| Profile for a 100g serving : |
| 10.54 mg (53%) | 184.00 kcal (9%) | 0.00 g (0%) | 6.28 g (10%) | 29.91 g (53%) | |
| Typical Serving size of 3.000 oz (or 85.00g): |
| 8.96 mg (45%) | 156.4 kcal (8%) | 0 g (0%) | 5.34 g (8%) | 25.42 g (45%) | |
| 16. Fish, mackerel, king, cooked, dry heat - Niacin |
| Nutritional Value : 16.00 / 100 food group - Finfish and Shellfish Products |
| Niacin | Energy | Carbohydrate | Total Fat | Protein |
| Profile for a 100g serving : |
| 10.46 mg (52%) | 134.00 kcal (7%) | 0.00 g (0%) | 2.56 g (4%) | 26.00 g (46%) | |
| Typical Serving size of 3.000 oz (or 85.00g): |
| 8.89 mg (44%) | 113.9 kcal (6%) | 0 g (0%) | 2.18 g (3%) | 22.1 g (39%) | |
| Other serving sizes 0.500 fillet (or 154.00g): |
| 16.11 mg (81%) | 206.36 kcal (10%) | 0 g (0%) | 3.94 g (6%) | 40.04 g (72%) | |
| 17. Fish, tuna, light, canned in water, drained solids - Niacin |
| Nutritional Value : 16.00 / 100 food group - Finfish and Shellfish Products |
| Niacin | Energy | Carbohydrate | Total Fat | Protein |
| Profile for a 100g serving : |
| 10.14 mg (51%) | 86.00 kcal (4%) | 0.00 g (0%) | 0.96 g (1%) | 19.44 g (35%) | |
| Typical Serving size of 1.000 oz (or 28.35g): |
| 2.87 mg (14%) | 24.38 kcal (1%) | 0 g (0%) | 0.27 g (0%) | 5.51 g (10%) | |
| Other serving sizes 3.000 oz (or 85.00g): |
| 8.62 mg (43%) | 73.1 kcal (4%) | 0 g (0%) | 0.82 g (1%) | 16.52 g (30%) | |
| Other serving sizes 1.000 can (or 165.00g): |
| 16.73 mg (84%) | 141.9 kcal (7%) | 0 g (0%) | 1.58 g (2%) | 32.08 g (57%) | |
| Other serving sizes 1.000 cup and solid or chunks (or 154.00g): |
| 15.62 mg (78%) | 132.44 kcal (7%) | 0 g (0%) | 1.48 g (2%) | 29.94 g (53%) | |
| Other serving sizes 1.000 can (12.5 oz) and drained (or 315.00g): |
| 31.94 mg (160%) | 270.9 kcal (14%) | 0 g (0%) | 3.02 g (5%) | 61.24 g (109%) | |
| 18. Fish, salmon, sockeye, cooked, dry heat - Niacin |
| Nutritional Value : 15.00 / 100 food group - Finfish and Shellfish Products |
| Niacin | Energy | Carbohydrate | Total Fat | Protein |
| Profile for a 100g serving : |
| 10.12 mg (51%) | 156.00 kcal (8%) | 0.00 g (0%) | 5.57 g (9%) | 26.48 g (47%) | |
| Typical Serving size of 3.000 oz (or 85.00g): |
| 8.6 mg (43%) | 132.6 kcal (7%) | 0 g (0%) | 4.73 g (7%) | 22.51 g (40%) | |
| Other serving sizes 0.500 fillet (or 155.00g): |
| 15.69 mg (78%) | 241.8 kcal (12%) | 0 g (0%) | 8.63 g (13%) | 41.04 g (73%) | |
| 19. Fish, sturgeon, mixed species, cooked, dry heat - Niacin |
| Nutritional Value : 16.00 / 100 food group - Finfish and Shellfish Products |
| Niacin | Energy | Carbohydrate | Total Fat | Protein |
| Profile for a 100g serving : |
| 10.10 mg (51%) | 135.00 kcal (7%) | 0.00 g (0%) | 5.18 g (8%) | 20.70 g (37%) | |
| Typical Serving size of 3.000 oz (or 85.00g): |
| 8.59 mg (43%) | 114.75 kcal (6%) | 0 g (0%) | 4.4 g (7%) | 17.6 g (31%) | |
| Other serving sizes 1.000 cup and cooked (or 136.00g): |
| 13.74 mg (69%) | 183.6 kcal (9%) | 0 g (0%) | 7.04 g (11%) | 28.15 g (50%) | |
| Other serving sizes 1.000 piece (4-1/2" x 2-1/8" x 7/8") (or 145.00g): |
| 14.65 mg (73%) | 195.75 kcal (10%) | 0 g (0%) | 7.51 g (12%) | 30.02 g (54%) | |
| Other serving sizes 1.000 oz and boneless (or 28.35g): |
| 2.86 mg (14%) | 38.27 kcal (2%) | 0 g (0%) | 1.47 g (2%) | 5.87 g (10%) | |
| Other serving sizes 1.000 cubic inch and boneless (or 17.00g): |
| 1.72 mg (9%) | 22.95 kcal (1%) | 0 g (0%) | 0.88 g (1%) | 3.52 g (6%) | |
| 20. Fish, salmon, Atlantic, wild, cooked, dry heat - Niacin |
| Nutritional Value : 15.00 / 100 food group - Finfish and Shellfish Products |
| Niacin | Energy | Carbohydrate | Total Fat | Protein |
| Profile for a 100g serving : |
| 10.08 mg (50%) | 182.00 kcal (9%) | 0.00 g (0%) | 8.13 g (13%) | 25.44 g (45%) | |
| Typical Serving size of 3.000 oz (or 85.00g): |
| 8.57 mg (43%) | 154.7 kcal (8%) | 0 g (0%) | 6.91 g (11%) | 21.62 g (39%) | |
| Other serving sizes 0.500 fillet (or 154.00g): |
| 15.52 mg (78%) | 280.28 kcal (14%) | 0 g (0%) | 12.52 g (19%) | 39.18 g (70%) | |
| 21. Fish, salmon, chinook, cooked, dry heat - Niacin |
| Nutritional Value : 15.00 / 100 food group - Finfish and Shellfish Products |
| Niacin | Energy | Carbohydrate | Total Fat | Protein |
| Profile for a 100g serving : |
| 10.05 mg (50%) | 231.00 kcal (12%) | 0.00 g (0%) | 13.38 g (21%) | 25.72 g (46%) | |
| Typical Serving size of 3.000 oz (or 85.00g): |
| 8.54 mg (43%) | 196.35 kcal (10%) | 0 g (0%) | 11.37 g (17%) | 21.86 g (39%) | |
| Other serving sizes 0.500 fillet (or 154.00g): |
| 15.48 mg (77%) | 355.74 kcal (18%) | 0 g (0%) | 20.61 g (32%) | 39.61 g (71%) | |
| 22. Fish, salmon, pink, cooked, dry heat - Niacin |
| Nutritional Value : 15.00 / 100 food group - Finfish and Shellfish Products |
| Niacin | Energy | Carbohydrate | Total Fat | Protein |
| Profile for a 100g serving : |
| 9.59 mg (48%) | 153.00 kcal (8%) | 0.00 g (0%) | 5.28 g (8%) | 24.58 g (44%) | |
| Typical Serving size of 3.000 oz (or 85.00g): |
| 8.15 mg (41%) | 130.05 kcal (7%) | 0 g (0%) | 4.49 g (7%) | 20.89 g (37%) | |
| Other serving sizes 0.500 fillet (or 124.00g): |
| 11.89 mg (59%) | 189.72 kcal (9%) | 0 g (0%) | 6.55 g (10%) | 30.48 g (54%) | |
| 23. Fish, swordfish, cooked, dry heat - Niacin |
| Nutritional Value : 15.00 / 100 food group - Finfish and Shellfish Products |
| Niacin | Energy | Carbohydrate | Total Fat | Protein |
| Profile for a 100g serving : |
| 9.25 mg (46%) | 172.00 kcal (9%) | 0.00 g (0%) | 7.93 g (12%) | 23.45 g (42%) | |
| Typical Serving size of 3.000 oz (or 85.00g): |
| 7.86 mg (39%) | 146.2 kcal (7%) | 0 g (0%) | 6.74 g (10%) | 19.93 g (36%) | |
| Other serving sizes 1.000 piece (or 106.00g): |
| 9.81 mg (49%) | 182.32 kcal (9%) | 0 g (0%) | 8.41 g (13%) | 24.86 g (44%) | |
| 24. Fish, mackerel, Atlantic, raw - Niacin |
| Nutritional Value : 15.00 / 100 food group - Finfish and Shellfish Products |
| Niacin | Energy | Carbohydrate | Total Fat | Protein |
| Profile for a 100g serving : |
| 9.08 mg (45%) | 205.00 kcal (10%) | 0.00 g (0%) | 13.89 g (21%) | 18.60 g (33%) | |
| Typical Serving size of 1.000 fillet (or 112.00g): |
| 10.17 mg (51%) | 229.6 kcal (11%) | 0 g (0%) | 15.56 g (24%) | 20.83 g (37%) | |
| Other serving sizes 3.000 oz (or 85.00g): |
| 7.72 mg (39%) | 174.25 kcal (9%) | 0 g (0%) | 11.81 g (18%) | 15.81 g (28%) | |
| 25. Fish, yellowtail, mixed species, cooked, dry heat - Niacin |
| Nutritional Value : 15.00 / 100 food group - Finfish and Shellfish Products |
| Niacin | Energy | Carbohydrate | Total Fat | Protein |
| Profile for a 100g serving : |
| 8.72 mg (44%) | 187.00 kcal (9%) | 0.00 g (0%) | 6.72 g (10%) | 29.67 g (53%) | |
| Typical Serving size of 0.500 fillet (or 146.00g): |
| 12.73 mg (64%) | 273.02 kcal (14%) | 0 g (0%) | 9.81 g (15%) | 43.32 g (77%) | |
| Other serving sizes 3.000 oz (or 85.00g): |
| 7.41 mg (37%) | 158.95 kcal (8%) | 0 g (0%) | 5.71 g (9%) | 25.22 g (45%) | |
| 26. Fish, salmon, Atlantic, farmed, raw - Niacin |
| Nutritional Value : 15.00 / 100 food group - Finfish and Shellfish Products |
| Niacin | Energy | Carbohydrate | Total Fat | Protein |
| Profile for a 100g serving : |
| 8.67 mg (43%) | 208.00 kcal (10%) | 0.00 g (0%) | 13.42 g (21%) | 20.42 g (36%) | |
| Typical Serving size of 3.000 oz (or 85.00g): |
| 7.37 mg (37%) | 176.8 kcal (9%) | 0 g (0%) | 11.41 g (18%) | 17.36 g (31%) | |
| Other serving sizes 0.500 fillet (or 198.00g): |
| 17.17 mg (86%) | 411.84 kcal (21%) | 0 g (0%) | 26.57 g (41%) | 40.43 g (72%) | |
| 27. Fish, tuna, fresh, bluefin, raw - Niacin |
| Nutritional Value : 16.00 / 100 food group - Finfish and Shellfish Products |
| Niacin | Energy | Carbohydrate | Total Fat | Protein |
| Profile for a 100g serving : |
| 8.65 mg (43%) | 144.00 kcal (7%) | 0.00 g (0%) | 4.90 g (8%) | 23.33 g (42%) | |
| Typical Serving size of 3.000 oz (or 85.00g): |
| 7.35 mg (37%) | 122.4 kcal (6%) | 0 g (0%) | 4.17 g (6%) | 19.83 g (35%) | |
| 28. Fish, mackerel, king, raw - Niacin |
| Nutritional Value : 16.00 / 100 food group - Finfish and Shellfish Products |
| Niacin | Energy | Carbohydrate | Total Fat | Protein |
| Profile for a 100g serving : |
| 8.59 mg (43%) | 105.00 kcal (5%) | 0.00 g (0%) | 2.00 g (3%) | 20.28 g (36%) | |
| Typical Serving size of 3.000 oz (or 85.00g): |
| 7.3 mg (37%) | 89.25 kcal (4%) | 0 g (0%) | 1.7 g (3%) | 17.24 g (31%) | |
| Other serving sizes 0.500 fillet (or 198.00g): |
| 17.01 mg (85%) | 207.9 kcal (10%) | 0 g (0%) | 3.96 g (6%) | 40.15 g (72%) | |
| 29. Fish, spot, cooked, dry heat - Niacin |
| Nutritional Value : 15.00 / 100 food group - Finfish and Shellfish Products |
| Niacin | Energy | Carbohydrate | Total Fat | Protein |
| Profile for a 100g serving : |
| 8.53 mg (43%) | 158.00 kcal (8%) | 0.00 g (0%) | 6.28 g (10%) | 23.73 g (42%) | |
| Typical Serving size of 1.000 fillet (or 50.00g): |
| 4.27 mg (21%) | 79 kcal (4%) | 0 g (0%) | 3.14 g (5%) | 11.87 g (21%) | |
| Other serving sizes 3.000 oz (or 85.00g): |
| 7.25 mg (36%) | 134.3 kcal (7%) | 0 g (0%) | 5.34 g (8%) | 20.17 g (36%) | |
| 30. Fish, salmon, chum, cooked, dry heat - Niacin |
| Nutritional Value : 15.00 / 100 food group - Finfish and Shellfish Products |
| Niacin | Energy | Carbohydrate | Total Fat | Protein |
| Profile for a 100g serving : |
| 8.53 mg (43%) | 154.00 kcal (8%) | 0.00 g (0%) | 4.83 g (7%) | 25.82 g (46%) | |
| Typical Serving size of 3.000 oz (or 85.00g): |
| 7.25 mg (36%) | 130.9 kcal (7%) | 0 g (0%) | 4.11 g (6%) | 21.95 g (39%) | |
| Other serving sizes 0.500 fillet (or 154.00g): |
| 13.14 mg (66%) | 237.16 kcal (12%) | 0 g (0%) | 7.44 g (11%) | 39.76 g (71%) | |
| 31. Fish, salmon, sockeye, raw - Niacin |
| Nutritional Value : 15.00 / 100 food group - Finfish and Shellfish Products |
| Niacin | Energy | Carbohydrate | Total Fat | Protein |
| Profile for a 100g serving : |
| 8.51 mg (43%) | 131.00 kcal (7%) | 0.00 g (0%) | 4.69 g (7%) | 22.25 g (40%) | |
| Typical Serving size of 1.000 oz and boneless (or 28.35g): |
| 2.41 mg (12%) | 37.14 kcal (2%) | 0 g (0%) | 1.33 g (2%) | 6.31 g (11%) | |
| Other serving sizes 0.500 fillet (or 198.00g): |
| 16.85 mg (84%) | 259.38 kcal (13%) | 0 g (0%) | 9.29 g (14%) | 44.06 g (79%) | |
| Other serving sizes 3.000 oz (or 85.00g): |
| 7.23 mg (36%) | 111.35 kcal (6%) | 0 g (0%) | 3.99 g (6%) | 18.91 g (34%) | |
| 32. Fish, salmon, chinook, raw - Niacin |
| Nutritional Value : 16.00 / 100 food group - Finfish and Shellfish Products |
| Niacin | Energy | Carbohydrate | Total Fat | Protein |
| Profile for a 100g serving : |
| 8.42 mg (42%) | 179.00 kcal (9%) | 0.00 g (0%) | 10.43 g (16%) | 19.93 g (36%) | |
| Typical Serving size of 3.000 oz (or 85.00g): |
| 7.16 mg (36%) | 152.15 kcal (8%) | 0 g (0%) | 8.87 g (14%) | 16.94 g (30%) | |
| Other serving sizes 0.500 fillet (or 198.00g): |
| 16.67 mg (83%) | 354.42 kcal (18%) | 0 g (0%) | 20.65 g (32%) | 39.46 g (70%) | |
| 33. Fish, shad, american, raw - Niacin |
| Nutritional Value : 15.00 / 100 food group - Finfish and Shellfish Products |
| Niacin | Energy | Carbohydrate | Total Fat | Protein |
| Profile for a 100g serving : |
| 8.40 mg (42%) | 197.00 kcal (10%) | 0.00 g (0%) | 13.77 g (21%) | 16.93 g (30%) | |
| Typical Serving size of 3.000 oz (or 85.00g): |
| 7.14 mg (36%) | 167.45 kcal (8%) | 0 g (0%) | 11.7 g (18%) | 14.39 g (26%) | |
| Other serving sizes 1.000 fillet (or 184.00g): |
| 15.46 mg (77%) | 362.48 kcal (18%) | 0 g (0%) | 25.34 g (39%) | 31.15 g (56%) | |
| 34. Fish, mackerel, Pacific and jack, mixed species, raw - Niacin |
| Nutritional Value : 15.00 / 100 food group - Finfish and Shellfish Products |
| Niacin | Energy | Carbohydrate | Total Fat | Protein |
| Profile for a 100g serving : |
| 8.32 mg (42%) | 158.00 kcal (8%) | 0.00 g (0%) | 7.89 g (12%) | 20.07 g (36%) | |
| Typical Serving size of 3.000 oz (or 85.00g): |
| 7.07 mg (35%) | 134.3 kcal (7%) | 0 g (0%) | 6.71 g (10%) | 17.06 g (30%) | |
| Other serving sizes 1.000 fillet (or 225.00g): |
| 18.72 mg (94%) | 355.5 kcal (18%) | 0 g (0%) | 17.75 g (27%) | 45.16 g (81%) | |
| 35. Fish, sturgeon, mixed species, raw - Niacin |
| Nutritional Value : 16.00 / 100 food group - Finfish and Shellfish Products |
| Niacin | Energy | Carbohydrate | Total Fat | Protein |
| Profile for a 100g serving : |
| 8.30 mg (42%) | 105.00 kcal (5%) | 0.00 g (0%) | 4.04 g (6%) | 16.14 g (29%) | |
| Typical Serving size of 3.000 oz (or 85.00g): |
| 7.06 mg (35%) | 89.25 kcal (4%) | 0 g (0%) | 3.43 g (5%) | 13.72 g (25%) | |
| 36. Fish, milkfish, cooked, dry heat - Niacin |
| Nutritional Value : 15.00 / 100 food group - Finfish and Shellfish Products |
| Niacin | Energy | Carbohydrate | Total Fat | Protein |
| Profile for a 100g serving : |
| 8.26 mg (41%) | 190.00 kcal (10%) | 0.00 g (0%) | 8.63 g (13%) | 26.32 g (47%) | |
| Typical Serving size of 3.000 oz (or 85.00g): |
| 7.02 mg (35%) | 161.5 kcal (8%) | 0 g (0%) | 7.34 g (11%) | 22.37 g (40%) | |
| 37. Fish, salmon, Atlantic, farmed, cooked, dry heat - Niacin |
| Nutritional Value : 15.00 / 100 food group - Finfish and Shellfish Products |
| Niacin | Energy | Carbohydrate | Total Fat | Protein |
| Profile for a 100g serving : |
| 8.05 mg (40%) | 206.00 kcal (10%) | 0.00 g (0%) | 12.35 g (19%) | 22.10 g (39%) | |
| Typical Serving size of 3.000 oz (or 85.00g): |
| 6.84 mg (34%) | 175.1 kcal (9%) | 0 g (0%) | 10.5 g (16%) | 18.79 g (34%) | |
| Other serving sizes 0.500 fillet (or 178.00g): |
| 14.33 mg (72%) | 366.68 kcal (18%) | 0 g (0%) | 21.98 g (34%) | 39.34 g (70%) | |
| 38. Fish, salmon, pink, raw - Niacin |
| Nutritional Value : 15.00 / 100 food group - Finfish and Shellfish Products |
| Niacin | Energy | Carbohydrate | Total Fat | Protein |
| Profile for a 100g serving : |
| 8.00 mg (40%) | 127.00 kcal (6%) | 0.00 g (0%) | 4.40 g (7%) | 20.50 g (37%) | |
| Typical Serving size of 3.000 oz (or 85.00g): |
| 6.8 mg (34%) | 107.95 kcal (5%) | 0 g (0%) | 3.74 g (6%) | 17.43 g (31%) | |
| Other serving sizes 0.500 fillet (or 159.00g): |
| 12.72 mg (64%) | 201.93 kcal (10%) | 0 g (0%) | 7 g (11%) | 32.6 g (58%) | |
| 39. Fish, salmon, coho, wild, cooked, dry heat - Niacin |
| Nutritional Value : 16.00 / 100 food group - Finfish and Shellfish Products |
| Niacin | Energy | Carbohydrate | Total Fat | Protein |
| Profile for a 100g serving : |
| 7.95 mg (40%) | 139.00 kcal (7%) | 0.00 g (0%) | 4.30 g (7%) | 23.45 g (42%) | |
| Typical Serving size of 3.000 oz (or 85.00g): |
| 6.76 mg (34%) | 118.15 kcal (6%) | 0 g (0%) | 3.66 g (6%) | 19.93 g (36%) | |
| Other serving sizes 0.500 fillet (or 178.00g): |
| 14.15 mg (71%) | 247.42 kcal (12%) | 0 g (0%) | 7.65 g (12%) | 41.74 g (75%) | |
| 40. Fish, halibut, Atlantic and Pacific, cooked, dry heat - Niacin |
| Nutritional Value : 16.00 / 100 food group - Finfish and Shellfish Products |
| Niacin | Energy | Carbohydrate | Total Fat | Protein |
| Profile for a 100g serving : |
| 7.91 mg (40%) | 111.00 kcal (6%) | 0.00 g (0%) | 1.61 g (2%) | 22.54 g (40%) | |
| Typical Serving size of 3.000 oz (or 85.00g): |
| 6.72 mg (34%) | 94.35 kcal (5%) | 0 g (0%) | 1.37 g (2%) | 19.16 g (34%) | |
| Other serving sizes 0.500 fillet (or 159.00g): |
| 12.58 mg (63%) | 176.49 kcal (9%) | 0 g (0%) | 2.56 g (4%) | 35.84 g (64%) | |
| 41. Fish, salmon, Atlantic, wild, raw - Niacin |
| Nutritional Value : 15.00 / 100 food group - Finfish and Shellfish Products |
| Niacin | Energy | Carbohydrate | Total Fat | Protein |
| Profile for a 100g serving : |
| 7.86 mg (39%) | 142.00 kcal (7%) | 0.00 g (0%) | 6.34 g (10%) | 19.84 g (35%) | |
| Typical Serving size of 3.000 oz (or 85.00g): |
| 6.68 mg (33%) | 120.7 kcal (6%) | 0 g (0%) | 5.39 g (8%) | 16.86 g (30%) | |
| Other serving sizes 0.500 fillet (or 198.00g): |
| 15.56 mg (78%) | 281.16 kcal (14%) | 0 g (0%) | 12.55 g (19%) | 39.28 g (70%) | |
| 42. Fish, salmon, coho, wild, cooked, moist heat - Niacin |
| Nutritional Value : 15.00 / 100 food group - Finfish and Shellfish Products |
| Niacin | Energy | Carbohydrate | Total Fat | Protein |
| Profile for a 100g serving : |
| 7.78 mg (39%) | 184.00 kcal (9%) | 0.00 g (0%) | 7.50 g (12%) | 27.36 g (49%) | |
| Typical Serving size of 3.000 oz (or 85.00g): |
| 6.61 mg (33%) | 156.4 kcal (8%) | 0 g (0%) | 6.38 g (10%) | 23.26 g (42%) | |
| Other serving sizes 0.500 fillet (or 155.00g): |
| 12.06 mg (60%) | 285.2 kcal (14%) | 0 g (0%) | 11.63 g (18%) | 42.41 g (76%) | |
| 43. Fish, swordfish, raw - Niacin |
| Nutritional Value : 15.00 / 100 food group - Finfish and Shellfish Products |
| Niacin | Energy | Carbohydrate | Total Fat | Protein |
| Profile for a 100g serving : |
| 7.76 mg (39%) | 144.00 kcal (7%) | 0.00 g (0%) | 6.65 g (10%) | 19.66 g (35%) | |
| Typical Serving size of 3.000 oz (or 85.00g): |
| 6.6 mg (33%) | 122.4 kcal (6%) | 0 g (0%) | 5.65 g (9%) | 16.71 g (30%) | |
| Other serving sizes 1.000 piece (4-1/2" x 2-1/8" x 7/8") (or 136.00g): |
| 10.55 mg (53%) | 195.84 kcal (10%) | 0 g (0%) | 9.04 g (14%) | 26.74 g (48%) | |
| 44. Fish, salmon, sockeye, canned, drained solids - Niacin |
| Nutritional Value : 15.00 / 100 food group - Finfish and Shellfish Products |
| Niacin | Energy | Carbohydrate | Total Fat | Protein |
| Profile for a 100g serving : |
| 7.62 mg (38%) | 167.00 kcal (8%) | 0.00 g (0%) | 7.39 g (11%) | 23.59 g (42%) | |
| Typical Serving size of 3.000 oz (or 85.00g): |
| 6.48 mg (32%) | 141.95 kcal (7%) | 0 g (0%) | 6.28 g (10%) | 20.05 g (36%) | |
| Other serving sizes 1.000 can (or 337.00g): |
| 25.68 mg (128%) | 562.79 kcal (28%) | 0 g (0%) | 24.9 g (38%) | 79.5 g (142%) | |
| 45. Fish, cod, Atlantic, dried and salted - Niacin |
| Nutritional Value : 16.00 / 100 food group - Finfish and Shellfish Products |
| Niacin | Energy | Carbohydrate | Total Fat | Protein |
| Profile for a 100g serving : |
| 7.50 mg (38%) | 290.00 kcal (15%) | 0.00 g (0%) | 2.37 g (4%) | 62.82 g (112%) | |
| Typical Serving size of 1.000 oz (or 28.35g): |
| 2.13 mg (11%) | 82.22 kcal (4%) | 0 g (0%) | 0.67 g (1%) | 17.81 g (32%) | |
| Other serving sizes 1.000 piece (5-1/2" x 1-1/2" x 1/2") (or 80.00g): |
| 6 mg (30%) | 232 kcal (12%) | 0 g (0%) | 1.9 g (3%) | 50.26 g (90%) | |
| Other serving sizes 3.000 oz (or 85.00g): |
| 6.38 mg (32%) | 246.5 kcal (12%) | 0 g (0%) | 2.01 g (3%) | 53.4 g (95%) | |
| 46. Fish, mahimahi, cooked, dry heat - Niacin |
| Nutritional Value : 15.00 / 100 food group - Finfish and Shellfish Products |
| Niacin | Energy | Carbohydrate | Total Fat | Protein |
| Profile for a 100g serving : |
| 7.43 mg (37%) | 109.00 kcal (5%) | 0.00 g (0%) | 0.90 g (1%) | 23.72 g (42%) | |
| Typical Serving size of 3.000 oz (or 85.00g): |
| 6.32 mg (32%) | 92.65 kcal (5%) | 0 g (0%) | 0.77 g (1%) | 20.16 g (36%) | |
| Other serving sizes 1.000 fillet (or 159.00g): |
| 11.81 mg (59%) | 173.31 kcal (9%) | 0 g (0%) | 1.43 g (2%) | 37.71 g (67%) | |
| 47. Fish, Salmon, pink, canned, drained solids, without skin and bones - Niacin |
| Nutritional Value : 15.00 / 100 food group - Finfish and Shellfish Products |
| Niacin | Energy | Carbohydrate | Total Fat | Protein |
| Profile for a 100g serving : |
| 7.43 mg (37%) | 136.00 kcal (7%) | 0.00 g (0%) | 4.21 g (6%) | 24.62 g (44%) | |
| Typical Serving size of 3.000 oz (or 85.00g): |
| 6.32 mg (32%) | 115.6 kcal (6%) | 0 g (0%) | 3.58 g (6%) | 20.93 g (37%) | |
| Other serving sizes 1.000 can drained solids and bone and skin removed (or 242.00g): |
| 17.98 mg (90%) | 329.12 kcal (16%) | 0 g (0%) | 10.19 g (16%) | 59.58 g (106%) | |
| 48. Fish, salmon, pink, canned, drained solids - Niacin |
| Nutritional Value : 16.00 / 100 food group - Finfish and Shellfish Products |
| Niacin | Energy | Carbohydrate | Total Fat | Protein |
| Profile for a 100g serving : |
| 7.41 mg (37%) | 138.00 kcal (7%) | 0.00 g (0%) | 5.02 g (8%) | 23.10 g (41%) | |
| Typical Serving size of 3.000 oz (or 85.00g): |
| 6.3 mg (32%) | 117.3 kcal (6%) | 0 g (0%) | 4.27 g (7%) | 19.64 g (35%) | |
| Other serving sizes 1.000 can drained solids (total) (or 315.00g): |
| 23.34 mg (117%) | 434.7 kcal (22%) | 0 g (0%) | 15.81 g (24%) | 72.77 g (130%) | |
| 49. Fish, salmon, coho, farmed, cooked, dry heat - Niacin |
| Nutritional Value : 15.00 / 100 food group - Finfish and Shellfish Products |
| Niacin | Energy | Carbohydrate | Total Fat | Protein |
| Profile for a 100g serving : |
| 7.39 mg (37%) | 178.00 kcal (9%) | 0.00 g (0%) | 8.23 g (13%) | 24.30 g (43%) | |
| Typical Serving size of 1.000 fillet (or 143.00g): |
| 10.57 mg (53%) | 254.54 kcal (13%) | 0 g (0%) | 11.77 g (18%) | 34.75 g (62%) | |
| Other serving sizes 3.000 oz (or 85.00g): |
| 6.28 mg (31%) | 151.3 kcal (8%) | 0 g (0%) | 7 g (11%) | 20.66 g (37%) | |
| 50. Fish, bluefish, cooked, dry heat - Niacin |
| Nutritional Value : 15.00 / 100 food group - Finfish and Shellfish Products |
| Niacin | Energy | Carbohydrate | Total Fat | Protein |
| Profile for a 100g serving : |
| 7.25 mg (36%) | 159.00 kcal (8%) | 0.00 g (0%) | 5.44 g (8%) | 25.69 g (46%) | |
| Typical Serving size of 1.000 fillet (or 117.00g): |
| 8.48 mg (42%) | 186.03 kcal (9%) | 0 g (0%) | 6.36 g (10%) | 30.06 g (54%) | |
| Other serving sizes 3.000 oz (or 85.00g): |
| 6.16 mg (31%) | 135.15 kcal (7%) | 0 g (0%) | 4.62 g (7%) | 21.84 g (39%) | |
| 51. Fish, salmon, coho, wild, raw - Niacin |
| Nutritional Value : 16.00 / 100 food group - Finfish and Shellfish Products |
| Niacin | Energy | Carbohydrate | Total Fat | Protein |
| Profile for a 100g serving : |
| 7.23 mg (36%) | 146.00 kcal (7%) | 0.00 g (0%) | 5.93 g (9%) | 21.62 g (39%) | |
| Typical Serving size of 3.000 oz (or 85.00g): |
| 6.15 mg (31%) | 124.1 kcal (6%) | 0 g (0%) | 5.04 g (8%) | 18.38 g (33%) | |
| Other serving sizes 0.500 fillet (or 198.00g): |
| 14.32 mg (72%) | 289.08 kcal (14%) | 0 g (0%) | 11.74 g (18%) | 42.81 g (76%) | |
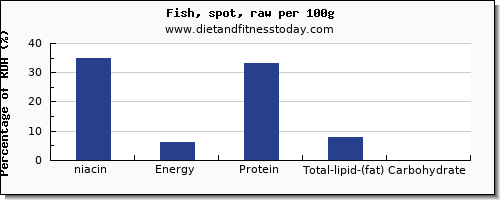
| 52. Fish, spot, raw - Niacin |
| Nutritional Value : 15.00 / 100 food group - Finfish and Shellfish Products |
| Niacin | Energy | Carbohydrate | Total Fat | Protein |
| Profile for a 100g serving : |
| 7.00 mg (35%) | 123.00 kcal (6%) | 0.00 g (0%) | 4.90 g (8%) | 18.51 g (33%) | |
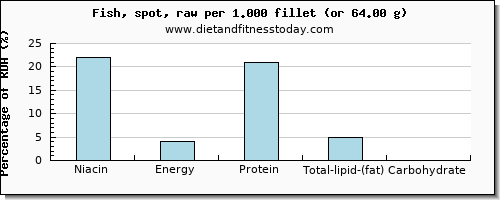
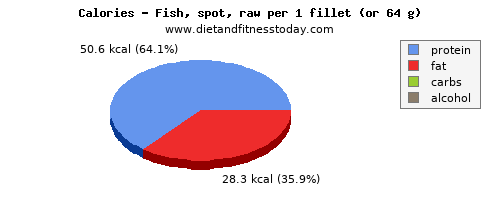
| Typical Serving size of 1.000 fillet (or 64.00g): |
| 4.48 mg (22%) | 78.72 kcal (4%) | 0 g (0%) | 3.14 g (5%) | 11.85 g (21%) | |
| Other serving sizes 3.000 oz (or 85.00g): |
| 5.95 mg (30%) | 104.55 kcal (5%) | 0 g (0%) | 4.17 g (6%) | 15.73 g (28%) | |
| 53. Fish, salmon, chum, canned, without salt, drained solids with bone - Niacin |
| Nutritional Value : 15.00 / 100 food group - Finfish and Shellfish Products |
| Niacin | Energy | Carbohydrate | Total Fat | Protein |
| Profile for a 100g serving : |
| 7.00 mg (35%) | 141.00 kcal (7%) | 0.00 g (0%) | 5.50 g (8%) | 21.43 g (38%) | |
| Typical Serving size of 3.000 oz (or 85.00g): |
| 5.95 mg (30%) | 119.85 kcal (6%) | 0 g (0%) | 4.68 g (7%) | 18.22 g (33%) | |
| Other serving sizes 1.000 can (or 369.00g): |
| 25.83 mg (129%) | 520.29 kcal (26%) | 0 g (0%) | 20.3 g (31%) | 79.08 g (141%) | |
| 54. Fish, salmon, chum, raw - Niacin |
| Nutritional Value : 15.00 / 100 food group - Finfish and Shellfish Products |
| Niacin | Energy | Carbohydrate | Total Fat | Protein |
| Profile for a 100g serving : |
| 7.00 mg (35%) | 120.00 kcal (6%) | 0.00 g (0%) | 3.77 g (6%) | 20.14 g (36%) | |
| Typical Serving size of 3.000 oz (or 85.00g): |
| 5.95 mg (30%) | 102 kcal (5%) | 0 g (0%) | 3.2 g (5%) | 17.12 g (31%) | |
| Other serving sizes 0.500 fillet (or 198.00g): |
| 13.86 mg (69%) | 237.6 kcal (12%) | 0 g (0%) | 7.46 g (11%) | 39.88 g (71%) | |
| 55. Fish, salmon, chum, canned, drained solids with bone - Niacin |
| Nutritional Value : 16.00 / 100 food group - Finfish and Shellfish Products |
| Niacin | Energy | Carbohydrate | Total Fat | Protein |
| Profile for a 100g serving : |
| 7.00 mg (35%) | 141.00 kcal (7%) | 0.00 g (0%) | 5.50 g (8%) | 21.43 g (38%) | |
| Typical Serving size of 3.000 oz (or 85.00g): |
| 5.95 mg (30%) | 119.85 kcal (6%) | 0 g (0%) | 4.68 g (7%) | 18.22 g (33%) | |
| Other serving sizes 1.000 can (or 369.00g): |
| 25.83 mg (129%) | 520.29 kcal (26%) | 0 g (0%) | 20.3 g (31%) | 79.08 g (141%) | |
| 56. Fish, mackerel, Atlantic, cooked, dry heat - Niacin |
| Nutritional Value : 15.00 / 100 food group - Finfish and Shellfish Products |
| Niacin | Energy | Carbohydrate | Total Fat | Protein |
| Profile for a 100g serving : |
| 6.85 mg (34%) | 262.00 kcal (13%) | 0.00 g (0%) | 17.81 g (27%) | 23.85 g (43%) | |
| Typical Serving size of 1.000 fillet (or 88.00g): |
| 6.03 mg (30%) | 230.56 kcal (12%) | 0 g (0%) | 15.67 g (24%) | 20.99 g (37%) | |
| Other serving sizes 3.000 oz (or 85.00g): |
| 5.82 mg (29%) | 222.7 kcal (11%) | 0 g (0%) | 15.14 g (23%) | 20.27 g (36%) | |
| 57. Fish, salmon, coho, farmed, raw - Niacin |
| Nutritional Value : 15.00 / 100 food group - Finfish and Shellfish Products |
| Niacin | Energy | Carbohydrate | Total Fat | Protein |
| Profile for a 100g serving : |
| 6.81 mg (34%) | 160.00 kcal (8%) | 0.00 g (0%) | 7.67 g (12%) | 21.27 g (38%) | |
| Typical Serving size of 3.000 oz (or 85.00g): |
| 5.79 mg (29%) | 136 kcal (7%) | 0 g (0%) | 6.52 g (10%) | 18.08 g (32%) | |
| Other serving sizes 1.000 fillet (or 159.00g): |
| 10.83 mg (54%) | 254.4 kcal (13%) | 0 g (0%) | 12.2 g (19%) | 33.82 g (60%) | |
| 58. Fish, yellowtail, mixed species, raw - Niacin |
| Nutritional Value : 15.00 / 100 food group - Finfish and Shellfish Products |
| Niacin | Energy | Carbohydrate | Total Fat | Protein |
| Profile for a 100g serving : |
| 6.80 mg (34%) | 146.00 kcal (7%) | 0.00 g (0%) | 5.24 g (8%) | 23.14 g (41%) | |
| Typical Serving size of 3.000 oz (or 85.00g): |
| 5.78 mg (29%) | 124.1 kcal (6%) | 0 g (0%) | 4.45 g (7%) | 19.67 g (35%) | |
| Other serving sizes 0.500 fillet (or 187.00g): |
| 12.72 mg (64%) | 273.02 kcal (14%) | 0 g (0%) | 9.8 g (15%) | 43.27 g (77%) | |
| 59. Fish, tuna salad - Niacin |
| Nutritional Value : 14.00 / 100 food group - Finfish and Shellfish Products |
| Niacin | Energy | Carbohydrate | Total Fat | Protein |
| Profile for a 100g serving : |
| 6.70 mg (34%) | 187.00 kcal (9%) | 9.41 g (7%) | 9.26 g (14%) | 16.04 g (29%) | |
| Typical Serving size of 3.000 oz (or 85.00g): |
| 5.7 mg (29%) | 158.95 kcal (8%) | 8 g (6%) | 7.87 g (12%) | 13.63 g (24%) | |
| Other serving sizes 1.000 cup (or 205.00g): |
| 13.74 mg (69%) | 383.35 kcal (19%) | 19.29 g (15%) | 18.98 g (29%) | 32.88 g (59%) | |
| 60. Fish, trout, rainbow, farmed, cooked, dry heat - Niacin |
| Nutritional Value : 16.00 / 100 food group - Finfish and Shellfish Products |
| Niacin | Energy | Carbohydrate | Total Fat | Protein |
| Profile for a 100g serving : |
| 6.65 mg (33%) | 168.00 kcal (8%) | 0.00 g (0%) | 7.38 g (11%) | 23.80 g (43%) | |
| Typical Serving size of 1.000 fillet (or 71.00g): |
| 4.72 mg (24%) | 119.28 kcal (6%) | 0 g (0%) | 5.24 g (8%) | 16.9 g (30%) | |
| Other serving sizes 3.000 oz (or 85.00g): |
| 5.65 mg (28%) | 142.8 kcal (7%) | 0 g (0%) | 6.27 g (10%) | 20.23 g (36%) | |
| 61. Fish, salmon, pink, canned, without salt, solids with bone and liquid - Niacin |
| Nutritional Value : 15.00 / 100 food group - Finfish and Shellfish Products |
| Niacin | Energy | Carbohydrate | Total Fat | Protein |
| Profile for a 100g serving : |
| 6.54 mg (33%) | 139.00 kcal (7%) | 0.00 g (0%) | 6.05 g (9%) | 19.78 g (35%) | |
| Typical Serving size of 3.000 oz (or 85.00g): |
| 5.56 mg (28%) | 118.15 kcal (6%) | 0 g (0%) | 5.14 g (8%) | 16.81 g (30%) | |
| Other serving sizes 1.000 can (or 454.00g): |
| 29.69 mg (148%) | 631.06 kcal (32%) | 0 g (0%) | 27.47 g (42%) | 89.8 g (160%) | |
| 62. Fish, salmon, pink, canned, total can contents - Niacin |
| Nutritional Value : 16.00 / 100 food group - Finfish and Shellfish Products |
| Niacin | Energy | Carbohydrate | Total Fat | Protein |
| Profile for a 100g serving : |
| 6.54 mg (33%) | 129.00 kcal (6%) | 0.00 g (0%) | 4.97 g (8%) | 19.68 g (35%) | |
| Typical Serving size of 3.000 oz (or 85.00g): |
| 5.56 mg (28%) | 109.65 kcal (5%) | 0 g (0%) | 4.22 g (6%) | 16.73 g (30%) | |
| Other serving sizes 1.000 can (or 411.00g): |
| 26.88 mg (134%) | 530.19 kcal (27%) | 0 g (0%) | 20.43 g (31%) | 80.88 g (144%) | |
| 63. Fish, halibut, Atlantic and Pacific, raw - Niacin |
| Nutritional Value : 16.00 / 100 food group - Finfish and Shellfish Products |
| Niacin | Energy | Carbohydrate | Total Fat | Protein |
| Profile for a 100g serving : |
| 6.51 mg (33%) | 91.00 kcal (5%) | 0.00 g (0%) | 1.33 g (2%) | 18.56 g (33%) | |
| Typical Serving size of 3.000 oz (or 85.00g): |
| 5.53 mg (28%) | 77.35 kcal (4%) | 0 g (0%) | 1.13 g (2%) | 15.78 g (28%) | |
| Other serving sizes 0.500 fillet (or 204.00g): |
| 13.28 mg (66%) | 185.64 kcal (9%) | 0 g (0%) | 2.71 g (4%) | 37.86 g (68%) | |
| 64. Fish, milkfish, raw - Niacin |
| Nutritional Value : 14.00 / 100 food group - Finfish and Shellfish Products |
| Niacin | Energy | Carbohydrate | Total Fat | Protein |
| Profile for a 100g serving : |
| 6.44 mg (32%) | 148.00 kcal (7%) | 0.00 g (0%) | 6.73 g (10%) | 20.53 g (37%) | |
| Typical Serving size of 3.000 oz (or 85.00g): |
| 5.47 mg (27%) | 125.8 kcal (6%) | 0 g (0%) | 5.72 g (9%) | 17.45 g (31%) | |
| 65. Fish, mullet, striped, cooked, dry heat - Niacin |
| Nutritional Value : 15.00 / 100 food group - Finfish and Shellfish Products |
| Niacin | Energy | Carbohydrate | Total Fat | Protein |
| Profile for a 100g serving : |
| 6.30 mg (32%) | 150.00 kcal (8%) | 0.00 g (0%) | 4.86 g (7%) | 24.81 g (44%) | |
| Typical Serving size of 1.000 fillet (or 93.00g): |
| 5.86 mg (29%) | 139.5 kcal (7%) | 0 g (0%) | 4.52 g (7%) | 23.07 g (41%) | |
| Other serving sizes 3.000 oz (or 85.00g): |
| 5.36 mg (27%) | 127.5 kcal (6%) | 0 g (0%) | 4.13 g (6%) | 21.09 g (38%) | |
| 66. Fish, mackerel, jack, canned, drained solids - Niacin |
| Nutritional Value : 16.00 / 100 food group - Finfish and Shellfish Products |
| Niacin | Energy | Carbohydrate | Total Fat | Protein |
| Profile for a 100g serving : |
| 6.18 mg (31%) | 156.00 kcal (8%) | 0.00 g (0%) | 6.30 g (10%) | 23.19 g (41%) | |
| Typical Serving size of 1.000 oz and boneless (or 28.35g): |
| 1.75 mg (9%) | 44.23 kcal (2%) | 0 g (0%) | 1.79 g (3%) | 6.57 g (12%) | |
| Other serving sizes 1.000 cup (or 190.00g): |
| 11.74 mg (59%) | 296.4 kcal (15%) | 0 g (0%) | 11.97 g (18%) | 44.06 g (79%) | |
| Other serving sizes 1.000 cubic inch (or 16.00g): |
| 0.99 mg (5%) | 24.96 kcal (1%) | 0 g (0%) | 1.01 g (2%) | 3.71 g (7%) | |
| Other serving sizes 1.000 can (15 oz) (or 361.00g): |
| 22.31 mg (112%) | 563.16 kcal (28%) | 0 g (0%) | 22.74 g (35%) | 83.72 g (150%) | |
| 67. Fish, mahimahi, raw - Niacin |
| Nutritional Value : 16.00 / 100 food group - Finfish and Shellfish Products |
| Niacin | Energy | Carbohydrate | Total Fat | Protein |
| Profile for a 100g serving : |
| 6.10 mg (31%) | 85.00 kcal (4%) | 0.00 g (0%) | 0.70 g (1%) | 18.50 g (33%) | |
| Typical Serving size of 3.000 oz (or 85.00g): |
| 5.19 mg (26%) | 72.25 kcal (4%) | 0 g (0%) | 0.6 g (1%) | 15.73 g (28%) | |
| Other serving sizes 1.000 fillet (or 204.00g): |
| 12.44 mg (62%) | 173.4 kcal (9%) | 0 g (0%) | 1.43 g (2%) | 37.74 g (67%) | |
| 68. Fish, bluefish, raw - Niacin |
| Nutritional Value : 15.00 / 100 food group - Finfish and Shellfish Products |
| Niacin | Energy | Carbohydrate | Total Fat | Protein |
| Profile for a 100g serving : |
| 5.95 mg (30%) | 124.00 kcal (6%) | 0.00 g (0%) | 4.24 g (7%) | 20.04 g (36%) | |
| Typical Serving size of 1.000 fillet (or 150.00g): |
| 8.93 mg (45%) | 186 kcal (9%) | 0 g (0%) | 6.36 g (10%) | 30.06 g (54%) | |
| Other serving sizes 3.000 oz (or 85.00g): |
| 5.06 mg (25%) | 105.4 kcal (5%) | 0 g (0%) | 3.6 g (6%) | 17.03 g (30%) | |
| 69. Fish, tuna, white, canned in water, drained solids - Niacin |
| Nutritional Value : 15.00 / 100 food group - Finfish and Shellfish Products |
| Niacin | Energy | Carbohydrate | Total Fat | Protein |
| Profile for a 100g serving : |
| 5.80 mg (29%) | 128.00 kcal (6%) | 0.00 g (0%) | 2.97 g (5%) | 23.62 g (42%) | |
| Typical Serving size of 3.000 oz (or 85.00g): |
| 4.93 mg (25%) | 108.8 kcal (5%) | 0 g (0%) | 2.52 g (4%) | 20.08 g (36%) | |
| Other serving sizes 1.000 can (or 172.00g): |
| 9.98 mg (50%) | 220.16 kcal (11%) | 0 g (0%) | 5.11 g (8%) | 40.63 g (73%) | |
| 70. Fish, tuna, white, canned in water, without salt, drained solids - Niacin |
| Nutritional Value : 15.00 / 100 food group - Finfish and Shellfish Products |
| Niacin | Energy | Carbohydrate | Total Fat | Protein |
| Profile for a 100g serving : |
| 5.80 mg (29%) | 128.00 kcal (6%) | 0.00 g (0%) | 2.97 g (5%) | 23.62 g (42%) | |
| Typical Serving size of 3.000 oz (or 85.00g): |
| 4.93 mg (25%) | 108.8 kcal (5%) | 0 g (0%) | 2.52 g (4%) | 20.08 g (36%) | |
| Other serving sizes 1.000 can (or 172.00g): |
| 9.98 mg (50%) | 220.16 kcal (11%) | 0 g (0%) | 5.11 g (8%) | 40.63 g (73%) | |
| 71. Fish, trout, rainbow, wild, cooked, dry heat - Niacin |
| Nutritional Value : 15.00 / 100 food group - Finfish and Shellfish Products |
| Niacin | Energy | Carbohydrate | Total Fat | Protein |
| Profile for a 100g serving : |
| 5.77 mg (29%) | 150.00 kcal (8%) | 0.00 g (0%) | 5.82 g (9%) | 22.92 g (41%) | |
| Typical Serving size of 1.000 fillet (or 143.00g): |
| 8.25 mg (41%) | 214.5 kcal (11%) | 0 g (0%) | 8.32 g (13%) | 32.78 g (59%) | |
| Other serving sizes 3.000 oz (or 85.00g): |
| 4.9 mg (25%) | 127.5 kcal (6%) | 0 g (0%) | 4.95 g (8%) | 19.48 g (35%) | |
| 72. Fish, butterfish, cooked, dry heat - Niacin |
| Nutritional Value : 14.00 / 100 food group - Finfish and Shellfish Products |
| Niacin | Energy | Carbohydrate | Total Fat | Protein |
| Profile for a 100g serving : |
| 5.77 mg (29%) | 187.00 kcal (9%) | 0.00 g (0%) | 10.28 g (16%) | 22.15 g (40%) | |
| Typical Serving size of 1.000 fillet (or 25.00g): |
| 1.44 mg (7%) | 46.75 kcal (2%) | 0 g (0%) | 2.57 g (4%) | 5.54 g (10%) | |
| Other serving sizes 3.000 oz (or 85.00g): |
| 4.9 mg (25%) | 158.95 kcal (8%) | 0 g (0%) | 8.74 g (13%) | 18.83 g (34%) | |
| 73. Fish, trout, mixed species, cooked, dry heat - Niacin |
| Nutritional Value : 15.00 / 100 food group - Finfish and Shellfish Products |
| Niacin | Energy | Carbohydrate | Total Fat | Protein |
| Profile for a 100g serving : |
| 5.77 mg (29%) | 190.00 kcal (10%) | 0.00 g (0%) | 8.47 g (13%) | 26.63 g (48%) | |
| Typical Serving size of 1.000 fillet (or 62.00g): |
| 3.58 mg (18%) | 117.8 kcal (6%) | 0 g (0%) | 5.25 g (8%) | 16.51 g (29%) | |
| Other serving sizes 3.000 oz (or 85.00g): |
| 4.9 mg (25%) | 161.5 kcal (8%) | 0 g (0%) | 7.2 g (11%) | 22.64 g (40%) | |
| 74. Fish, trout, rainbow, farmed, raw - Niacin |
| Nutritional Value : 16.00 / 100 food group - Finfish and Shellfish Products |
| Niacin | Energy | Carbohydrate | Total Fat | Protein |
| Profile for a 100g serving : |
| 5.57 mg (28%) | 141.00 kcal (7%) | 0.00 g (0%) | 6.18 g (10%) | 19.94 g (36%) | |
| Typical Serving size of 1.000 fillet (or 79.00g): |
| 4.4 mg (22%) | 111.39 kcal (6%) | 0 g (0%) | 4.88 g (8%) | 15.75 g (28%) | |
| Other serving sizes 3.000 oz (or 85.00g): |
| 4.73 mg (24%) | 119.85 kcal (6%) | 0 g (0%) | 5.25 g (8%) | 16.95 g (30%) | |
| 75. Fish, salmon, sockeye, canned, without salt, drained solids with bone - Niacin |
| Nutritional Value : 15.00 / 100 food group - Finfish and Shellfish Products |
| Niacin | Energy | Carbohydrate | Total Fat | Protein |
| Profile for a 100g serving : |
| 5.48 mg (27%) | 153.00 kcal (8%) | 0.00 g (0%) | 7.31 g (11%) | 20.47 g (37%) | |
| Typical Serving size of 3.000 oz (or 85.00g): |
| 4.66 mg (23%) | 130.05 kcal (7%) | 0 g (0%) | 6.21 g (10%) | 17.4 g (31%) | |
| Other serving sizes 1.000 can (or 369.00g): |
| 20.22 mg (101%) | 564.57 kcal (28%) | 0 g (0%) | 26.97 g (41%) | 75.53 g (135%) | |
| 76. Fish, trout, rainbow, wild, raw - Niacin |
| Nutritional Value : 16.00 / 100 food group - Finfish and Shellfish Products |
| Niacin | Energy | Carbohydrate | Total Fat | Protein |
| Profile for a 100g serving : |
| 5.38 mg (27%) | 119.00 kcal (6%) | 0.00 g (0%) | 3.46 g (5%) | 20.48 g (37%) | |
| Typical Serving size of 3.000 oz (or 85.00g): |
| 4.57 mg (23%) | 101.15 kcal (5%) | 0 g (0%) | 2.94 g (5%) | 17.41 g (31%) | |
| Other serving sizes 1.000 fillet (or 159.00g): |
| 8.55 mg (43%) | 189.21 kcal (9%) | 0 g (0%) | 5.5 g (8%) | 32.56 g (58%) | |
| 77. Fish, sablefish, smoked - Niacin |
| Nutritional Value : 14.00 / 100 food group - Finfish and Shellfish Products |
| Niacin | Energy | Carbohydrate | Total Fat | Protein |
| Profile for a 100g serving : |
| 5.30 mg (27%) | 257.00 kcal (13%) | 0.00 g (0%) | 20.14 g (31%) | 17.65 g (32%) | |
| Typical Serving size of 1.000 oz (or 28.35g): |
| 1.5 mg (8%) | 72.86 kcal (4%) | 0 g (0%) | 5.71 g (9%) | 5 g (9%) | |
| Other serving sizes 3.000 oz (or 85.00g): |
| 4.51 mg (23%) | 218.45 kcal (11%) | 0 g (0%) | 17.12 g (26%) | 15 g (27%) | |
| 78. Fish, trout, brook, raw, New York State - Niacin |
| Nutritional Value : 14.00 / 100 food group - Finfish and Shellfish Products |
| Niacin | Energy | Carbohydrate | Total Fat | Protein |
| Profile for a 100g serving : |
| 5.29 mg (26%) | 110.00 kcal (6%) | 0.00 g (0%) | 2.73 g (4%) | 21.23 g (38%) | |
| Typical Serving size of 1.000 filet (or 149.00g): |
| 7.88 mg (39%) | 163.9 kcal (8%) | 0 g (0%) | 4.07 g (6%) | 31.63 g (56%) | |
| Other serving sizes 1.000 fish (or 332.00g): |
| 17.56 mg (88%) | 365.2 kcal (18%) | 0 g (0%) | 9.06 g (14%) | 70.48 g (126%) | |
| 79. Fish, sardine, Atlantic, canned in oil, drained solids with bone - Niacin |
| Nutritional Value : 16.00 / 100 food group - Finfish and Shellfish Products |
| Niacin | Energy | Carbohydrate | Total Fat | Protein |
| Profile for a 100g serving : |
| 5.25 mg (26%) | 208.00 kcal (10%) | 0.00 g (0%) | 11.45 g (18%) | 24.62 g (44%) | |
| Typical Serving size of 1.000 cup and drained (or 149.00g): |
| 7.82 mg (39%) | 309.92 kcal (15%) | 0 g (0%) | 17.06 g (26%) | 36.68 g (66%) | |
| Other serving sizes 1.000 oz (or 28.35g): |
| 1.49 mg (7%) | 58.97 kcal (3%) | 0 g (0%) | 3.25 g (5%) | 6.98 g (12%) | |
| Other serving sizes 1.000 cubic inch (or 16.00g): |
| 0.84 mg (4%) | 33.28 kcal (2%) | 0 g (0%) | 1.83 g (3%) | 3.94 g (7%) | |
| Other serving sizes 1.000 can (3.75 oz) (or 92.00g): |
| 4.83 mg (24%) | 191.36 kcal (10%) | 0 g (0%) | 10.53 g (16%) | 22.65 g (40%) | |
| Other serving sizes 1.000 small (2-2/3" x 1/2" x 1/4") (or 12.00g): |
| 0.63 mg (3%) | 24.96 kcal (1%) | 0 g (0%) | 1.37 g (2%) | 2.95 g (5%) | |
| Other serving sizes 2.000 sardines (or 24.00g): |
| 1.26 mg (6%) | 49.92 kcal (2%) | 0 g (0%) | 2.75 g (4%) | 5.91 g (11%) | |
| 80. Fish, mullet, striped, raw - Niacin |
| Nutritional Value : 16.00 / 100 food group - Finfish and Shellfish Products |
| Niacin | Energy | Carbohydrate | Total Fat | Protein |
| Profile for a 100g serving : |
| 5.20 mg (26%) | 117.00 kcal (6%) | 0.00 g (0%) | 3.79 g (6%) | 19.35 g (35%) | |
| Typical Serving size of 1.000 oz (or 28.35g): |
| 1.47 mg (7%) | 33.17 kcal (2%) | 0 g (0%) | 1.07 g (2%) | 5.49 g (10%) | |
| Other serving sizes 1.000 fillet (or 119.00g): |
| 6.19 mg (31%) | 139.23 kcal (7%) | 0 g (0%) | 4.51 g (7%) | 23.03 g (41%) | |
| Other serving sizes 3.000 oz (or 85.00g): |
| 4.42 mg (22%) | 99.45 kcal (5%) | 0 g (0%) | 3.22 g (5%) | 16.45 g (29%) | |
| 81. Fish, sablefish, cooked, dry heat - Niacin |
| Nutritional Value : 14.00 / 100 food group - Finfish and Shellfish Products |
| Niacin | Energy | Carbohydrate | Total Fat | Protein |
| Profile for a 100g serving : |
| 5.13 mg (26%) | 250.00 kcal (13%) | 0.00 g (0%) | 19.62 g (30%) | 17.19 g (31%) | |
| Typical Serving size of 3.000 oz (or 85.00g): |
| 4.36 mg (22%) | 212.5 kcal (11%) | 0 g (0%) | 16.68 g (26%) | 14.61 g (26%) | |
| Other serving sizes 0.500 fillet (or 151.00g): |
| 7.75 mg (39%) | 377.5 kcal (19%) | 0 g (0%) | 29.63 g (46%) | 25.96 g (46%) | |
| 82. Fish, haddock, smoked - Niacin |
| Nutritional Value : 16.00 / 100 food group - Finfish and Shellfish Products |
| Niacin | Energy | Carbohydrate | Total Fat | Protein |
| Profile for a 100g serving : |
| 5.07 mg (25%) | 116.00 kcal (6%) | 0.00 g (0%) | 0.96 g (1%) | 25.23 g (45%) | |
| Typical Serving size of 1.000 oz and boneless (or 28.35g): |
| 1.44 mg (7%) | 32.89 kcal (2%) | 0 g (0%) | 0.27 g (0%) | 7.15 g (13%) | |
| Other serving sizes 1.000 cubic inch and boneless (or 17.00g): |
| 0.86 mg (4%) | 19.72 kcal (1%) | 0 g (0%) | 0.16 g (0%) | 4.29 g (8%) | |
| Other serving sizes 3.000 oz (or 85.00g): |
| 4.31 mg (22%) | 98.6 kcal (5%) | 0 g (0%) | 0.82 g (1%) | 21.45 g (38%) | |
| 83. Fish, mackerel, spanish, cooked, dry heat - Niacin |
| Nutritional Value : 15.00 / 100 food group - Finfish and Shellfish Products |
| Niacin | Energy | Carbohydrate | Total Fat | Protein |
| Profile for a 100g serving : |
| 5.00 mg (25%) | 158.00 kcal (8%) | 0.00 g (0%) | 6.32 g (10%) | 23.59 g (42%) | |
| Typical Serving size of 1.000 fillet (or 146.00g): |
| 7.3 mg (37%) | 230.68 kcal (12%) | 0 g (0%) | 9.23 g (14%) | 34.44 g (62%) | |