Welcome to the nutritional niacin content in 15 different types of shrimp, ranging from 3.07 mg to 0.17 mg per 100g. The basic type of shrimp is DENNY'S, golden fried shrimp, where the amount of niacin in 100g is 2.47 mg. 2.47 mg of niacin per 100g, from DENNY'S, golden fried shrimp corresponds to 12% of the niacin RDA. For a typical serving size of 1.000 piece (or 16.00 g) the amount of Niacin is 0.4 mg. This corresponds to an RDA percentage of 2%.
The percentage of the recommended daily allowance (RDA) for niacin is based on a 20 mg RDA level for a mature adult.
Top ten shrimp products high in niacin
Below is a summary list for the top ten shrimp items ranked by the amount or level of niacin in 100g.
1. Crustaceans, shrimp, mixed species, cooked, breaded and fried : 3.07mg (15%RDA)
2. Crustaceans, shrimp, mixed species, cooked, moist heat (may have been previously frozen) : 2.68mg (13%RDA)
3. DENNY'S, golden fried shrimp : 2.47mg (12%RDA)
4. Crustaceans, shrimp, mixed species, raw (may have been previously frozen) : 1.78mg (9%RDA)
5. Restaurant, family style, shrimp, breaded and fried : 1.25mg (6%RDA)
6. Fast foods, shrimp, breaded and fried : 1.24mg (6%RDA)
7. Restaurant, Chinese, shrimp and vegetables : 0.94mg (5%RDA)
8. APPLEBEE'S, Double Crunch Shrimp : 0.90mg (5%RDA)
9. CRACKER BARREL, country fried shrimp platter : 0.87mg (4%RDA)
10. T.G.I. FRIDAY'S, FRIDAY'S Shrimp, breaded : 0.76mg (4%RDA)
Following on from the ten top shrimp items or products containing niacin we have a more comprehensive break down of DENNY'S, golden fried shrimp, and the highest item containing niacin which is Crustaceans, shrimp, mixed species, cooked, breaded and fried. We also give a comparison of average values, median values and lowest values along with a comparison with other food groups and assess the effects of storage and preparation on the 15 types of shrimp.
At the bottom of the page is the full list for the 15 different types of shrimp based on the content in different servings in grams and oz (and other serving sizes), providing a comprehensive analysis of the niacin content in shrimp.
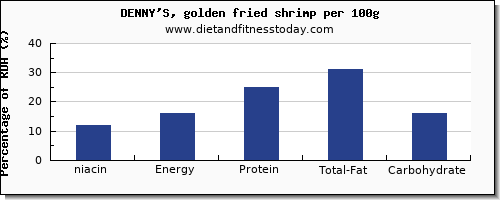
DENNY'S, golden fried shrimp - Nutritional Content and Chart
The full nutrition content, RDA percentages and levels for DENNY'S, golden fried shrimp should be considered along with the niacin content. This food profile is part of our list of food and drinks under the general group Restaurant Foods.Other important and niacin related nutrients are Energy, Protein, Total Fat and Carbohydrate. For this 100g serving in your diet, the amount of Energy is 319.00 kcal (16% RDA), the amount of Protein is 13.88 g (25% RDA), the amount of Total Fat is 20.01 g (31% RDA) and the amount of Carbohydrate is 20.93 g (16% RDA). The nutritional content and facts for 100g, which includes Energy, Protein, Total Fat and Carbohydrate is shown in the RDA chart below as percentages of the recommended daily allowance along with the niacin levels in shrimp.
Our proprietary nutritional density score gives a nutritional value out of 100 based on 9 different vitamins, minerals and macro nutrients. DENNY'S, golden fried shrimp has a nutritional value score of 14.00 out of 100.Comparing the niacin content and the nutritional density in 100g for DENNY'S, golden fried shrimp; We class this as a medium to low niacin content item.In terms of overall nutritional value we class this as an item with a medium nutritional density value.
Amount of niacin per 100 Calories
100 calories of dENNY'S, golden fried shrimp is a serving size of 0 g, and the amount of Niacin is 0 mg (0% RDA). Other important and related nutrients and macronutrients such as Total Fat, in 100 Calories are as follows; Energy 0 kcal (0% RDA), Protein 0 g (0% RDA), Total Fat 0 g (0% RDA), Carbohydrate 0 g (0% RDA). This is shown in the niacin RDA percentage chart below, based on 100 Calories, along with the other important nutrients and macro nutrients.
Content per Typical Serving Size 1.000 piece (or 16.00 g)
For the food DENNY'S, golden fried shrimp the typical serving size is 1.000 piece (or 16.00 g) which contains 0.4 mg of Niacin. The niacin percentage of the recommended daily value for this serving is 2 %.To give 100% of the RDA, 50.0 servings of the typical serving size 1.000 piece (or 16.00 g) give the complete RDA. In terms of the gram weight and total content for this serving the Energy content is 51.04 kcal, the Protein content is 2.22 g, the Total Fat content is 3.2 g and the Carbohydrate content is 3.35 g. The percentages are shown below in the niacin chart, for the typical serving of niacin and the related and important nutritional values.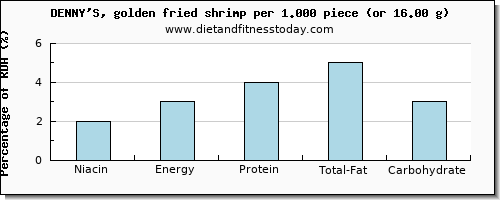
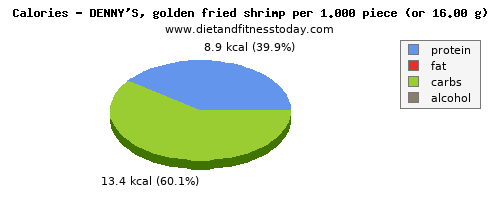
Macronutrients in DENNY'S, golden fried shrimp
The amount of protein, fat and carbs from this food described above is measured in grams per 100g and grams in a typical serving size (in this case 1.000 piece or 16.00 g), although it is also useful to give the number of calories from protein, fat and carbohydrate which are the most important macronutrients. For this serving in your diet here are the macronutrient calories. From protein the number of calories is 8.9 (kcal).The total calories from carbohydrate is 13.4 (kcal).
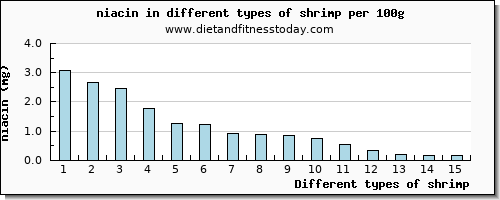
Milligrams of niacin in shrimp (per 100g)
This list of 15 types of shrimp, is brought to you by www.dietandfitnesstoday.com and ranges from Crustaceans, shrimp, mixed species, cooked, breaded and fried through to Crustaceans, shrimp, mixed species, imitation, made from surimi where all food items are ranked by the content or amount per 100g. The nutritional niacin content can be scaled by the amount in grams, oz or typical serving sizes. Simply click on a food item or beverage from the list at the bottom of the page to give a full dietary nutritional breakdown to answer the question how much niacin in shrimp.
The list below gives the total niacin content in the 15 items from the general description 'shrimp' each of which show the niacin amount as well as Energy, Protein, Total Fat and Carbohydrate. Below, is the top 15 food items shown in the niacin chart. This gives a quick and easy dietary comparison for the different items, where each item is listed at the bottom of the page with a nutritional summary.
The corresponding nutritional value for shrimp based on our density score out of 100 (ranked by the amount of niacin per 100g) is shown in the below nutritional density chart. 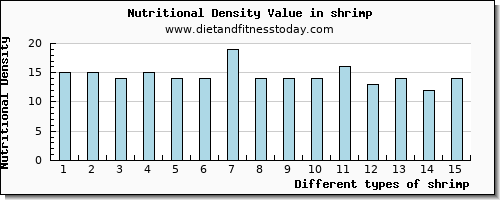
The corresponding Calories for shrimp ranked by the amount of niacin per 100g is shown below in the shrimp calories chart. 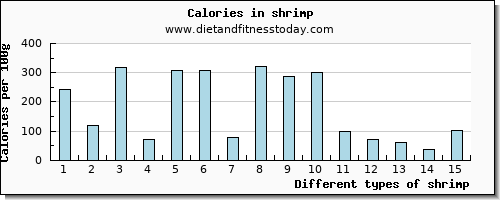
Effect of Preparation and Storage on niacin
The level of niacin can be affected by the method of storage for example canned or frozen and also by the method of preparation for example either raw, cooked or fried. The total number of frozen food items is 2. The highest amount of niacin from the 2 frozen items is in Crustaceans, shrimp, mixed species, cooked, moist heat (may have been previously frozen) where the niacin content is 2.68 mg per 100g. The number of food items classified as canned is 4 items. The highest amount of niacin from the 4 canned items is in Crustaceans, shrimp, mixed species, canned where the level is 0.56 mg per 100g.The total food items which are raw is 1 item. The highest amount of niacin from the 1 raw items is in Crustaceans, shrimp, mixed species, raw (may have been previously frozen) where the content is 1.78 mg per 100g. The number of food items which are cooked are 2 items. The highest amount of niacin from the 2 cooked items is in Crustaceans, shrimp, mixed species, cooked, breaded and fried where the amount is 3.07 mg per 100g. Comparing raw and cooked shrimp shows that cooking can change the levels of niacin by 1.29 mg in a 100g serving. The number of food items described as lowfat or non-fat is 1 item.Average Content for shrimp
The average (or more correctly the arithmetic mean) amount of niacin contained in 100g of shrimp, based on the list below of 15 different items under the general description of shrimp, is 1.16 mg of niacin. This average value corresponds to 5.8 % of the recommended dietary allowance (or RDA) in your diet. The averages for the different nutrients are as follows; the average amount of Energy is 181.80 kcal, the average amount of Protein is 11.59 g, the average amount of Total Fat is 9.57 g and the average amount of Carbohydrate is g.Median Amount
The median value of Niacin is found in APPLEBEE'S, Double Crunch Shrimp which in 100g contains 0.90 mg of Niacin. This corresponds to 5 % of the recommended daily allowance. For this serving the amount of Energy is 323.00 kcal, the amount of Protein is 12.31 g, the amount of Total Fat is 18.90 g and the amount of Carbohydrate is 25.96 g.Highest niacin Content per 100g
Using the list below for the 15 different shrimp nutrition entries in our database, the highest amount of niacin is found in Crustaceans, shrimp, mixed species, cooked, breaded and fried which contains 3.07 mg of niacin per 100g. The associated percentage of RDA is 15 %. For this 100g serving the Energy content is 242.00 kcal, the Protein content is 21.39 g, the Total Fat content is 12.28 g, the Carbohydrate content is 11.47 g. 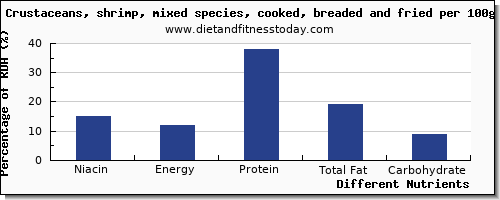
The lowest amount of niacin in 100g is in Crustaceans, shrimp, mixed species, imitation, made from surimi which contains 0.17 mg. This gives as percentage of the recommended daily allowance 1 % of the RDA. For this 100g serving the amount of Energy is 101.00 kcal, the amount of Protein is 12.39 g, the amount of Total Fat is 1.47 g, the amount of Carbohydrate is 9.13 g.
The difference between the highest and lowest values gives a niacin range of 2.9 mg per 100g. The range for the other nutrients are as follows; 141 kcal for Energy, 9 g for Protein, 10.81 g for Total Fat, 0 g for Carbohydrate.
Highest Amount of niacin per Serving
Please remember that the above gives an accurate value in 100g for high niacin foods in your diet. For example 100g of DENNY'S, golden fried shrimp contains 2.47 mg of niacin. However, there are other factors to consider when you are assessing your nutritional requirements. You should also take into account portion sizes when you are considering the niacin nutritional content.
The food with the highest niacin content per typical serving is Restaurant, Chinese, shrimp and vegetables which contains 5.65 mg in 1.000 order (or 601.00 g). The percentage of the recommended daily value for this serving is 28 %. For this serving the Energy content is 468.78 kcal, the Protein content is 35.46 g, the Total Fat content is 24.34 g and the Carbohydrate content is 27.17 g.
Nutritional Information Summary
From the list below you can find a full nutrition facts breakdown for all foods containing niacin which can be scaled for different servings and quantities. We have also sorted our complete nutritional information and vitamin database of over 7000 foods, to give a list of foods high in niacin.
| ||||||||||||||||||||||||||||||||||||||||||||||||||||||||||||||||||||||||||||||||||||||||||||||||||||||||||||||||||||||||||||||||||||||||||||||||||||||||||||||||||||||||||||||||||||||||||||||||||||||||||||||||||||||||||||||||||||||||||||||||||||||||||||||||||||||||||||||||||||||||||||||||||||||||||||||||||||||||||||||||||||||||||||||||||||||||||||||||||||||||||||||||||||||||||||||||||||||||||||||||||||||||||||||||||||||||||||||||||||||||||||||||||||||||||||||||||||||||||||||||||||||||||||||||||||||||||||||||||||||||||||||||||||||||||||||||||||||||||||||||||||||||||||||||||||||||||||||||||||||||||||||||||||||||||||||||||||||||||||||||||||||||||||||||||||||||||||||||||||||||||||||||||||||||||||||||||||||||||||||||||||||||||||||||||||||||||||