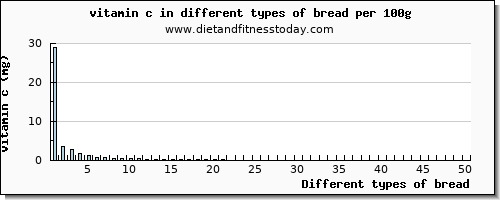
Bread List, vitamin c Content per 100g
|
|
|
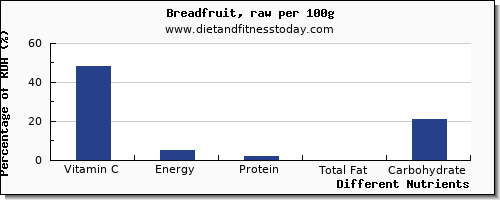
| 1. Breadfruit, raw - Vitamin C |
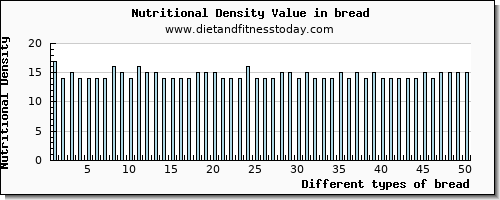
| Nutritional Value : 17.00 / 100 food group - |
Vitamin C
(%RDA) | Energy
(%RDA) | Carbohydrate
(%RDA) | Total Fat
(%RDA) | Protein
(%RDA) |
| Profile for a 100g serving : |
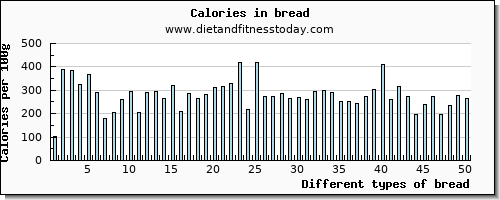
| 29.00 mg (48%) | 103.00 kcal (5%) | 27.12 g (21%) | 0.23 g (0%) | 1.07 g (2%) | |
| Typical Serving size of 1.000 cup (or 220.00g): |
| 63.8 mg (106%) | 226.6 kcal (11%) | 59.66 g (46%) | 0.51 g (1%) | 2.35 g (4%) | |
| Other serving sizes 0.250 fruit and small (or 96.00g): |
| 27.84 mg (46%) | 98.88 kcal (5%) | 26.04 g (20%) | 0.22 g (0%) | 1.03 g (2%) | |
| 2. Bread stuffing, cornbread, dry mix - Vitamin C |
| Nutritional Value : 14.00 / 100 food group - Baked Products |
| Vitamin C | Energy | Carbohydrate | Total Fat | Protein |
| Profile for a 100g serving : |
| 3.50 mg (6%) | 389.00 kcal (19%) | 76.70 g (59%) | 4.20 g (6%) | 10.00 g (18%) | |
| Typical Serving size of 1.000 oz (or 28.35g): |
| 0.99 mg (2%) | 110.28 kcal (6%) | 21.74 g (17%) | 1.19 g (2%) | 2.84 g (5%) | |
| Other serving sizes 1.000 package (6 oz) (or 170.00g): |
| 5.95 mg (10%) | 661.3 kcal (33%) | 130.39 g (100%) | 7.14 g (11%) | 17 g (30%) | |
| 3. Bread crumbs, dry, grated, seasoned - Vitamin C |
| Nutritional Value : 15.00 / 100 food group - Baked Products |
| Vitamin C | Energy | Carbohydrate | Total Fat | Protein |
| Profile for a 100g serving : |
| 2.70 mg (5%) | 383.00 kcal (19%) | 68.49 g (53%) | 5.48 g (8%) | 14.13 g (25%) | |
| Typical Serving size of 1.000 oz (or 28.35g): |
| 0.77 mg (1%) | 108.58 kcal (5%) | 19.42 g (15%) | 1.55 g (2%) | 4.01 g (7%) | |
| Other serving sizes 1.000 cup (or 120.00g): |
| 3.24 mg (5%) | 459.6 kcal (23%) | 82.19 g (63%) | 6.58 g (10%) | 16.96 g (30%) | |
| 4. Bread, banana, prepared from recipe, made with margarine - Vitamin C |
| Nutritional Value : 14.00 / 100 food group - Baked Products |
| Vitamin C | Energy | Carbohydrate | Total Fat | Protein |
| Profile for a 100g serving : |
| 1.70 mg (3%) | 326.00 kcal (16%) | 54.60 g (42%) | 10.50 g (16%) | 4.30 g (8%) | |
| Typical Serving size of 1.000 oz (or 28.35g): |
| 0.48 mg (1%) | 92.42 kcal (5%) | 15.48 g (12%) | 2.98 g (5%) | 1.22 g (2%) | |
| Other serving sizes 1.000 individual loaf (include Keebler Elfin Loaves) (or 57.00g): |
| 0.97 mg (2%) | 185.82 kcal (9%) | 31.12 g (24%) | 5.99 g (9%) | 2.45 g (4%) | |
| Other serving sizes 1.000 slice (or 60.00g): |
| 1.02 mg (2%) | 195.6 kcal (10%) | 32.76 g (25%) | 6.3 g (10%) | 2.58 g (5%) | |
| 5. Bread, pan dulce, sweet yeast bread - Vitamin C |
| Nutritional Value : 14.00 / 100 food group - Baked Products |
| Vitamin C | Energy | Carbohydrate | Total Fat | Protein |
| Profile for a 100g serving : |
| 1.20 mg (2%) | 367.00 kcal (18%) | 56.38 g (43%) | 11.58 g (18%) | 9.42 g (17%) | |
| Typical Serving size of 1.000 slice (average weight of 1 slice) (or 63.00g): |
| 0.76 mg (1%) | 231.21 kcal (12%) | 35.52 g (27%) | 7.3 g (11%) | 5.93 g (11%) | |
| 6. Bread, irish soda, prepared from recipe - Vitamin C |
| Nutritional Value : 14.00 / 100 food group - Baked Products |
| Vitamin C | Energy | Carbohydrate | Total Fat | Protein |
| Profile for a 100g serving : |
| 0.80 mg (1%) | 290.00 kcal (15%) | 56.00 g (43%) | 5.00 g (8%) | 6.60 g (12%) | |
| Typical Serving size of 1.000 oz (or 28.35g): |
| 0.23 mg (0%) | 82.22 kcal (4%) | 15.88 g (12%) | 1.42 g (2%) | 1.87 g (3%) | |
| 7. Bread stuffing, cornbread, dry mix, prepared - Vitamin C |
| Nutritional Value : 14.00 / 100 food group - Baked Products |
| Vitamin C | Energy | Carbohydrate | Total Fat | Protein |
| Profile for a 100g serving : |
| 0.80 mg (1%) | 179.00 kcal (9%) | 21.90 g (17%) | 8.80 g (14%) | 2.90 g (5%) | |
| Typical Serving size of 1.000 oz (or 28.35g): |
| 0.23 mg (0%) | 50.75 kcal (3%) | 6.21 g (5%) | 2.49 g (4%) | 0.82 g (1%) | |
| Other serving sizes 0.500 cup (or 100.00g): |
| 0.8 mg (1%) | 179 kcal (9%) | 21.9 g (17%) | 8.8 g (14%) | 2.9 g (5%) | |
| 8. Bread, reduced-calorie, white - Vitamin C |
| Nutritional Value : 16.00 / 100 food group - Baked Products |
| Vitamin C | Energy | Carbohydrate | Total Fat | Protein |
| Profile for a 100g serving : |
| 0.50 mg (1%) | 207.00 kcal (10%) | 44.30 g (34%) | 2.50 g (4%) | 8.70 g (16%) | |
| Typical Serving size of 1.000 oz (or 28.35g): |
| 0.14 mg (0%) | 58.68 kcal (3%) | 12.56 g (10%) | 0.71 g (1%) | 2.47 g (4%) | |
| Other serving sizes 1.000 slice (or 23.00g): |
| 0.12 mg (0%) | 47.61 kcal (2%) | 10.19 g (8%) | 0.58 g (1%) | 2 g (4%) | |
| 9. Bread, rye - Vitamin C |
| Nutritional Value : 15.00 / 100 food group - Baked Products |
| Vitamin C | Energy | Carbohydrate | Total Fat | Protein |
| Profile for a 100g serving : |
| 0.40 mg (1%) | 259.00 kcal (13%) | 48.30 g (37%) | 3.30 g (5%) | 8.50 g (15%) | |
| Typical Serving size of 1.000 oz (or 28.35g): |
| 0.11 mg (0%) | 73.43 kcal (4%) | 13.69 g (11%) | 0.94 g (1%) | 2.41 g (4%) | |
| Other serving sizes 1.000 slice and regular (or 32.00g): |
| 0.13 mg (0%) | 82.88 kcal (4%) | 15.46 g (12%) | 1.06 g (2%) | 2.72 g (5%) | |
| Other serving sizes 1.000 slice and snack-size (or 7.00g): |
| 0.03 mg (0%) | 18.13 kcal (1%) | 3.38 g (3%) | 0.23 g (0%) | 0.6 g (1%) | |
| Other serving sizes 1.000 slice and thin (or 25.00g): |
| 0.1 mg (0%) | 64.75 kcal (3%) | 12.08 g (9%) | 0.83 g (1%) | 2.13 g (4%) | |
| 10. Bread, raisin, enriched, toasted - Vitamin C |
| Nutritional Value : 14.00 / 100 food group - Baked Products |
| Vitamin C | Energy | Carbohydrate | Total Fat | Protein |
| Profile for a 100g serving : |
| 0.40 mg (1%) | 297.00 kcal (15%) | 56.90 g (44%) | 4.80 g (7%) | 8.60 g (15%) | |
| Typical Serving size of 1.000 oz (or 28.35g): |
| 0.11 mg (0%) | 84.2 kcal (4%) | 16.13 g (12%) | 1.36 g (2%) | 2.44 g (4%) | |
| Other serving sizes 1.000 slice and large (or 29.00g): |
| 0.12 mg (0%) | 86.13 kcal (4%) | 16.5 g (13%) | 1.39 g (2%) | 2.49 g (4%) | |
| Other serving sizes 1.000 slice (or 24.00g): |
| 0.1 mg (0%) | 71.28 kcal (4%) | 13.66 g (11%) | 1.15 g (2%) | 2.06 g (4%) | |
| Other serving sizes 1.000 slice and thin (or 21.00g): |
| 0.08 mg (0%) | 62.37 kcal (3%) | 11.95 g (9%) | 1.01 g (2%) | 1.81 g (3%) | |
| 11. Bread, reduced-calorie, rye - Vitamin C |
| Nutritional Value : 16.00 / 100 food group - Baked Products |
| Vitamin C | Energy | Carbohydrate | Total Fat | Protein |
| Profile for a 100g serving : |
| 0.40 mg (1%) | 203.00 kcal (10%) | 40.50 g (31%) | 2.90 g (4%) | 9.10 g (16%) | |
| Typical Serving size of 1.000 oz (or 28.35g): |
| 0.11 mg (0%) | 57.55 kcal (3%) | 11.48 g (9%) | 0.82 g (1%) | 2.58 g (5%) | |
| Other serving sizes 1.000 slice (or 23.00g): |
| 0.09 mg (0%) | 46.69 kcal (2%) | 9.32 g (7%) | 0.67 g (1%) | 2.09 g (4%) | |
| Other serving sizes 1.000 slice and thick (or 32.00g): |
| 0.13 mg (0%) | 64.96 kcal (3%) | 12.96 g (10%) | 0.93 g (1%) | 2.91 g (5%) | |
| Other serving sizes 1.000 slice and thin (or 20.00g): |
| 0.08 mg (0%) | 40.6 kcal (2%) | 8.1 g (6%) | 0.58 g (1%) | 1.82 g (3%) | |
| 12. Bread, oatmeal, toasted - Vitamin C |
| Nutritional Value : 15.00 / 100 food group - Baked Products |
| Vitamin C | Energy | Carbohydrate | Total Fat | Protein |
| Profile for a 100g serving : |
| 0.30 mg (1%) | 292.00 kcal (15%) | 52.70 g (41%) | 4.80 g (7%) | 9.20 g (16%) | |
| Typical Serving size of 1.000 oz (or 28.35g): |
| 0.09 mg (0%) | 82.78 kcal (4%) | 14.94 g (11%) | 1.36 g (2%) | 2.61 g (5%) | |
| Other serving sizes 1.000 slice (or 25.00g): |
| 0.08 mg (0%) | 73 kcal (4%) | 13.18 g (10%) | 1.2 g (2%) | 2.3 g (4%) | |
| 13. Bread, wheat germ, toasted - Vitamin C |
| Nutritional Value : 15.00 / 100 food group - Baked Products |
| Vitamin C | Energy | Carbohydrate | Total Fat | Protein |
| Profile for a 100g serving : |
| 0.30 mg (1%) | 293.00 kcal (15%) | 54.30 g (42%) | 3.30 g (5%) | 10.70 g (19%) | |
| Typical Serving size of 1.000 oz (or 28.35g): |
| 0.09 mg (0%) | 83.07 kcal (4%) | 15.39 g (12%) | 0.94 g (1%) | 3.03 g (5%) | |
| Other serving sizes 1.000 slice (or 25.00g): |
| 0.08 mg (0%) | 73.25 kcal (4%) | 13.58 g (10%) | 0.83 g (1%) | 2.68 g (5%) | |
| 14. Bread, cornbread, prepared from recipe, made with low fat (2%) milk - Vitamin C |
| Nutritional Value : 14.00 / 100 food group - Baked Products |
| Vitamin C | Energy | Carbohydrate | Total Fat | Protein |
| Profile for a 100g serving : |
| 0.30 mg (1%) | 266.00 kcal (13%) | 43.50 g (33%) | 7.10 g (11%) | 6.70 g (12%) | |
| Typical Serving size of 1.000 oz (or 28.35g): |
| 0.09 mg (0%) | 75.41 kcal (4%) | 12.33 g (9%) | 2.01 g (3%) | 1.9 g (3%) | |
| Other serving sizes 1.000 piece (or 65.00g): |
| 0.2 mg (0%) | 172.9 kcal (9%) | 28.28 g (22%) | 4.62 g (7%) | 4.36 g (8%) | |
| 15. Bread, french or vienna, toasted (includes sourdough) - Vitamin C |
| Nutritional Value : 14.00 / 100 food group - Baked Products |
| Vitamin C | Energy | Carbohydrate | Total Fat | Protein |
| Profile for a 100g serving : |
| 0.20 mg (0%) | 319.00 kcal (16%) | 61.93 g (48%) | 2.14 g (3%) | 13.00 g (23%) | |
| Typical Serving size of 1.000 oz (or 28.35g): |
| 0.06 mg (0%) | 90.44 kcal (5%) | 17.56 g (14%) | 0.61 g (1%) | 3.69 g (7%) | |
| Other serving sizes 1.000 slice and small (or 29.00g): |
| 0.06 mg (0%) | 92.51 kcal (5%) | 17.96 g (14%) | 0.62 g (1%) | 3.77 g (7%) | |
| Other serving sizes 1.000 slice and medium (or 59.00g): |
| 0.12 mg (0%) | 188.21 kcal (9%) | 36.54 g (28%) | 1.26 g (2%) | 7.67 g (14%) | |
| Other serving sizes 1.000 slice and large (or 88.00g): |
| 0.18 mg (0%) | 280.72 kcal (14%) | 54.5 g (42%) | 1.88 g (3%) | 11.44 g (20%) | |
| 16. Bread, reduced-calorie, oatmeal - Vitamin C |
| Nutritional Value : 14.00 / 100 food group - Baked Products |
| Vitamin C | Energy | Carbohydrate | Total Fat | Protein |
| Profile for a 100g serving : |
| 0.20 mg (0%) | 210.00 kcal (11%) | 43.30 g (33%) | 3.50 g (5%) | 7.60 g (14%) | |
| Typical Serving size of 1.000 oz (or 28.35g): |
| 0.06 mg (0%) | 59.54 kcal (3%) | 12.28 g (9%) | 0.99 g (2%) | 2.15 g (4%) | |
| Other serving sizes 1.000 slice (or 23.00g): |
| 0.05 mg (0%) | 48.3 kcal (2%) | 9.96 g (8%) | 0.81 g (1%) | 1.75 g (3%) | |
| 17. Bread, white, prepared from recipe, made with low fat (2%) milk - Vitamin C |
| Nutritional Value : 14.00 / 100 food group - Baked Products |
| Vitamin C | Energy | Carbohydrate | Total Fat | Protein |
| Profile for a 100g serving : |
| 0.20 mg (0%) | 285.00 kcal (14%) | 49.60 g (38%) | 5.70 g (9%) | 7.90 g (14%) | |
| Typical Serving size of 1.000 oz (or 28.35g): |
| 0.06 mg (0%) | 80.8 kcal (4%) | 14.06 g (11%) | 1.62 g (2%) | 2.24 g (4%) | |
| Other serving sizes 1.000 slice (or 42.00g): |
| 0.08 mg (0%) | 119.7 kcal (6%) | 20.83 g (16%) | 2.39 g (4%) | 3.32 g (6%) | |
| Other serving sizes 1.000 slice and thin (3-3/4" x 5" x 3/8") (or 33.00g): |
| 0.07 mg (0%) | 94.05 kcal (5%) | 16.37 g (13%) | 1.88 g (3%) | 2.61 g (5%) | |
| 18. Bread, wheat - Vitamin C |
| Nutritional Value : 15.00 / 100 food group - Baked Products |
| Vitamin C | Energy | Carbohydrate | Total Fat | Protein |
| Profile for a 100g serving : |
| 0.20 mg (0%) | 267.00 kcal (13%) | 48.68 g (37%) | 3.24 g (5%) | 10.72 g (19%) | |
| Typical Serving size of 1.000 oz (or 28.35g): |
| 0.06 mg (0%) | 75.69 kcal (4%) | 13.8 g (11%) | 0.92 g (1%) | 3.04 g (5%) | |
| Other serving sizes 1.000 slice (or 29.00g): |
| 0.06 mg (0%) | 77.43 kcal (4%) | 14.12 g (11%) | 0.94 g (1%) | 3.11 g (6%) | |
| 19. Bread, rye, toasted - Vitamin C |
| Nutritional Value : 15.00 / 100 food group - Baked Products |
| Vitamin C | Energy | Carbohydrate | Total Fat | Protein |
| Profile for a 100g serving : |
| 0.20 mg (0%) | 284.00 kcal (14%) | 53.10 g (41%) | 3.60 g (6%) | 9.40 g (17%) | |
| Typical Serving size of 1.000 oz (or 28.35g): |
| 0.06 mg (0%) | 80.51 kcal (4%) | 15.05 g (12%) | 1.02 g (2%) | 2.66 g (5%) | |
| Other serving sizes 1.000 slice and large (or 29.00g): |
| 0.06 mg (0%) | 82.36 kcal (4%) | 15.4 g (12%) | 1.04 g (2%) | 2.73 g (5%) | |
| Other serving sizes 1.000 slice and regular (or 24.00g): |
| 0.05 mg (0%) | 68.16 kcal (3%) | 12.74 g (10%) | 0.86 g (1%) | 2.26 g (4%) | |
| Other serving sizes 1.000 slice and thin (or 18.00g): |
| 0.04 mg (0%) | 51.12 kcal (3%) | 9.56 g (7%) | 0.65 g (1%) | 1.69 g (3%) | |
| 20. Bread, wheat, toasted - Vitamin C |
| Nutritional Value : 15.00 / 100 food group - Baked Products |
| Vitamin C | Energy | Carbohydrate | Total Fat | Protein |
| Profile for a 100g serving : |
| 0.20 mg (0%) | 313.00 kcal (16%) | 55.77 g (43%) | 4.27 g (7%) | 12.96 g (23%) | |
| Typical Serving size of 1.000 oz (or 28.35g): |
| 0.06 mg (0%) | 88.74 kcal (4%) | 15.81 g (12%) | 1.21 g (2%) | 3.67 g (7%) | |
| Other serving sizes 1.000 slice (or 24.00g): |
| 0.05 mg (0%) | 75.12 kcal (4%) | 13.38 g (10%) | 1.02 g (2%) | 3.11 g (6%) | |
| 21. Bread, roll, Mexican, bollilo - Vitamin C |
| Nutritional Value : 14.00 / 100 food group - Baked Products |
| Vitamin C | Energy | Carbohydrate | Total Fat | Protein |
| Profile for a 100g serving : |
| 0.20 mg (0%) | 318.00 kcal (16%) | 55.77 g (43%) | 5.80 g (9%) | 10.65 g (19%) | |
| Typical Serving size of 1.000 piece (or 98.00g): |
| 0.2 mg (0%) | 311.64 kcal (16%) | 54.65 g (42%) | 5.68 g (9%) | 10.44 g (19%) | |
| 22. Bread, cornbread, dry mix, prepared with 2% milk, 80% margarine, and eggs - Vitamin C |
| Nutritional Value : 14.00 / 100 food group - Baked Products |
| Vitamin C | Energy | Carbohydrate | Total Fat | Protein |
| Profile for a 100g serving : |
| 0.10 mg (0%) | 330.00 kcal (17%) | 54.46 g (42%) | 9.58 g (15%) | 6.59 g (12%) | |
| Typical Serving size of 1.000 muffin (or 51.00g): |
| 0.05 mg (0%) | 168.3 kcal (8%) | 27.77 g (21%) | 4.89 g (8%) | 3.36 g (6%) | |
| Other serving sizes 1.000 piece (or 60.00g): |
| 0.06 mg (0%) | 198 kcal (10%) | 32.68 g (25%) | 5.75 g (9%) | 3.95 g (7%) | |
| Other serving sizes 1.000 oz (or 28.35g): |
| 0.03 mg (0%) | 93.56 kcal (5%) | 15.44 g (12%) | 2.72 g (4%) | 1.87 g (3%) | |
| 23. Bread, cornbread, dry mix, enriched (includes corn muffin mix) - Vitamin C |
| Nutritional Value : 14.00 / 100 food group - Baked Products |
| Vitamin C | Energy | Carbohydrate | Total Fat | Protein |
| Profile for a 100g serving : |
| 0.10 mg (0%) | 418.00 kcal (21%) | 69.50 g (53%) | 12.20 g (19%) | 7.00 g (13%) | |
| Typical Serving size of 1.000 oz (or 28.35g): |
| 0.03 mg (0%) | 118.5 kcal (6%) | 19.7 g (15%) | 3.46 g (5%) | 1.98 g (4%) | |
| Other serving sizes 1.000 package (8.5 oz) (or 241.00g): |
| 0.24 mg (0%) | 1007.38 kcal (50%) | 167.5 g (129%) | 29.4 g (45%) | 16.87 g (30%) | |
| 24. Bread, reduced-calorie, wheat - Vitamin C |
| Nutritional Value : 16.00 / 100 food group - Baked Products |
| Vitamin C | Energy | Carbohydrate | Total Fat | Protein |
| Profile for a 100g serving : |
| 0.10 mg (0%) | 217.00 kcal (11%) | 42.47 g (33%) | 2.92 g (4%) | 13.32 g (24%) | |
| Typical Serving size of 1.000 oz (or 28.35g): |
| 0.03 mg (0%) | 61.52 kcal (3%) | 12.04 g (9%) | 0.83 g (1%) | 3.78 g (7%) | |
| Other serving sizes 1.000 slice (or 21.00g): |
| 0.02 mg (0%) | 45.57 kcal (2%) | 8.92 g (7%) | 0.61 g (1%) | 2.8 g (5%) | |
| 25. Bread, cornbread, dry mix, unenriched (includes corn muffin mix) - Vitamin C |
| Nutritional Value : 14.00 / 100 food group - Baked Products |
| Vitamin C | Energy | Carbohydrate | Total Fat | Protein |
| Profile for a 100g serving : |
| 0.10 mg (0%) | 418.00 kcal (21%) | 69.50 g (53%) | 12.20 g (19%) | 7.00 g (13%) | |
| Typical Serving size of 1.000 oz (or 28.35g): |
| 0.03 mg (0%) | 118.5 kcal (6%) | 19.7 g (15%) | 3.46 g (5%) | 1.98 g (4%) | |
| Other serving sizes 1.000 package (8.5 oz) (or 241.00g): |
| 0.24 mg (0%) | 1007.38 kcal (50%) | 167.5 g (129%) | 29.4 g (45%) | 16.87 g (30%) | |
| 26. Bread, raisin, enriched - Vitamin C |
| Nutritional Value : 14.00 / 100 food group - Baked Products |
| Vitamin C | Energy | Carbohydrate | Total Fat | Protein |
| Profile for a 100g serving : |
| 0.10 mg (0%) | 274.00 kcal (14%) | 52.30 g (40%) | 4.40 g (7%) | 7.90 g (14%) | |
| Typical Serving size of 1.000 oz (or 28.35g): |
| 0.03 mg (0%) | 77.68 kcal (4%) | 14.83 g (11%) | 1.25 g (2%) | 2.24 g (4%) | |
| Other serving sizes 1.000 slice and large (or 32.00g): |
| 0.03 mg (0%) | 87.68 kcal (4%) | 16.74 g (13%) | 1.41 g (2%) | 2.53 g (5%) | |
| Other serving sizes 1.000 slice (or 26.00g): |
| 0.03 mg (0%) | 71.24 kcal (4%) | 13.6 g (10%) | 1.14 g (2%) | 2.05 g (4%) | |
| Other serving sizes 1.000 slice and thin (or 23.00g): |
| 0.02 mg (0%) | 63.02 kcal (3%) | 12.03 g (9%) | 1.01 g (2%) | 1.82 g (3%) | |
| 27. Bread, raisin, unenriched - Vitamin C |
| Nutritional Value : 14.00 / 100 food group - Baked Products |
| Vitamin C | Energy | Carbohydrate | Total Fat | Protein |
| Profile for a 100g serving : |
| 0.10 mg (0%) | 274.00 kcal (14%) | 52.30 g (40%) | 4.40 g (7%) | 7.90 g (14%) | |
| Typical Serving size of 1.000 oz (or 28.35g): |
| 0.03 mg (0%) | 77.68 kcal (4%) | 14.83 g (11%) | 1.25 g (2%) | 2.24 g (4%) | |
| Other serving sizes 1.000 slice and large (or 32.00g): |
| 0.03 mg (0%) | 87.68 kcal (4%) | 16.74 g (13%) | 1.41 g (2%) | 2.53 g (5%) | |
| Other serving sizes 1.000 slice (or 26.00g): |
| 0.03 mg (0%) | 71.24 kcal (4%) | 13.6 g (10%) | 1.14 g (2%) | 2.05 g (4%) | |
| Other serving sizes 1.000 slice and thin (or 23.00g): |
| 0.02 mg (0%) | 63.02 kcal (3%) | 12.03 g (9%) | 1.01 g (2%) | 1.82 g (3%) | |
| 28. Bread, multi-grain, toasted (includes whole-grain) - Vitamin C |
| Nutritional Value : 15.00 / 100 food group - Baked Products |
| Vitamin C | Energy | Carbohydrate | Total Fat | Protein |
| Profile for a 100g serving : |
| 0.10 mg (0%) | 288.00 kcal (14%) | 47.11 g (36%) | 4.60 g (7%) | 14.52 g (26%) | |
| Typical Serving size of 1.000 oz (or 28.35g): |
| 0.03 mg (0%) | 81.65 kcal (4%) | 13.36 g (10%) | 1.3 g (2%) | 4.12 g (7%) | |
| Other serving sizes 1.000 slice regular (or 24.00g): |
| 0.02 mg (0%) | 69.12 kcal (3%) | 11.31 g (9%) | 1.1 g (2%) | 3.48 g (6%) | |
| Other serving sizes 1.000 slice large (or 38.00g): |
| 0.04 mg (0%) | 109.44 kcal (5%) | 17.9 g (14%) | 1.75 g (3%) | 5.52 g (10%) | |
| 29. Bread, multi-grain (includes whole-grain) - Vitamin C |
| Nutritional Value : 15.00 / 100 food group - Baked Products |
| Vitamin C | Energy | Carbohydrate | Total Fat | Protein |
| Profile for a 100g serving : |
| 0.10 mg (0%) | 265.00 kcal (13%) | 43.34 g (33%) | 4.23 g (7%) | 13.36 g (24%) | |
| Typical Serving size of 1.000 oz (or 28.35g): |
| 0.03 mg (0%) | 75.13 kcal (4%) | 12.29 g (9%) | 1.2 g (2%) | 3.79 g (7%) | |
| Other serving sizes 1.000 slice regular (or 26.00g): |
| 0.03 mg (0%) | 68.9 kcal (3%) | 11.27 g (9%) | 1.1 g (2%) | 3.47 g (6%) | |
| Other serving sizes 1.000 slice large (or 41.00g): |
| 0.04 mg (0%) | 108.65 kcal (5%) | 17.77 g (14%) | 1.73 g (3%) | 5.48 g (10%) | |
| 30. Bread, oatmeal - Vitamin C |
| Nutritional Value : 14.00 / 100 food group - Baked Products |
| Vitamin C | Energy | Carbohydrate | Total Fat | Protein |
| Profile for a 100g serving : |
| 0.00 mg (0%) | 269.00 kcal (13%) | 48.50 g (37%) | 4.40 g (7%) | 8.40 g (15%) | |
| Typical Serving size of 1.000 oz (or 28.35g): |
| 0 mg (0%) | 76.26 kcal (4%) | 13.75 g (11%) | 1.25 g (2%) | 2.38 g (4%) | |
| Other serving sizes 1.000 slice (or 27.00g): |
| 0 mg (0%) | 72.63 kcal (4%) | 13.1 g (10%) | 1.19 g (2%) | 2.27 g (4%) | |
| 31. Bread, oat bran, toasted - Vitamin C |
| Nutritional Value : 15.00 / 100 food group - Baked Products |
| Vitamin C | Energy | Carbohydrate | Total Fat | Protein |
| Profile for a 100g serving : |
| 0.00 mg (0%) | 259.00 kcal (13%) | 43.70 g (34%) | 4.80 g (7%) | 11.40 g (20%) | |
| Typical Serving size of 1.000 oz (or 28.35g): |
| 0 mg (0%) | 73.43 kcal (4%) | 12.39 g (10%) | 1.36 g (2%) | 3.23 g (6%) | |
| Other serving sizes 1.000 slice (or 27.00g): |
| 0 mg (0%) | 69.93 kcal (3%) | 11.8 g (9%) | 1.3 g (2%) | 3.08 g (6%) | |
| 32. Bread, white, commercially prepared, toasted, low sodium no salt - Vitamin C |
| Nutritional Value : 14.00 / 100 food group - Baked Products |
| Vitamin C | Energy | Carbohydrate | Total Fat | Protein |
| Profile for a 100g serving : |
| 0.00 mg (0%) | 293.00 kcal (15%) | 54.40 g (42%) | 4.00 g (6%) | 9.00 g (16%) | |
| Typical Serving size of 1.000 oz (or 28.35g): |
| 0 mg (0%) | 83.07 kcal (4%) | 15.42 g (12%) | 1.13 g (2%) | 2.55 g (5%) | |
| Other serving sizes 1.000 slice (or 23.00g): |
| 0 mg (0%) | 67.39 kcal (3%) | 12.51 g (10%) | 0.92 g (1%) | 2.07 g (4%) | |
| 33. Bread, chapati or roti, whole wheat, commercially prepared, frozen - Vitamin C |
| Nutritional Value : 14.00 / 100 food group - Baked Products |
| Vitamin C | Energy | Carbohydrate | Total Fat | Protein |
| Profile for a 100g serving : |
| 0.00 mg (0%) | 299.00 kcal (15%) | 46.13 g (35%) | 9.20 g (14%) | 7.85 g (14%) | |
| Typical Serving size of 1.000 piece (or 43.00g): |
| 0 mg (0%) | 128.57 kcal (6%) | 19.84 g (15%) | 3.96 g (6%) | 3.38 g (6%) | |
| 34. Bread, white, commercially prepared, toasted - Vitamin C |
| Nutritional Value : 14.00 / 100 food group - Baked Products |
| Vitamin C | Energy | Carbohydrate | Total Fat | Protein |
| Profile for a 100g serving : |
| 0.00 mg (0%) | 290.00 kcal (15%) | 54.50 g (42%) | 4.00 g (6%) | 9.00 g (16%) | |
| Typical Serving size of 1.000 oz (or 28.35g): |
| 0 mg (0%) | 82.22 kcal (4%) | 15.45 g (12%) | 1.13 g (2%) | 2.55 g (5%) | |
| Other serving sizes 1.000 cup and crumbs (or 45.00g): |
| 0 mg (0%) | 130.5 kcal (7%) | 24.53 g (19%) | 1.8 g (3%) | 4.05 g (7%) | |
| Other serving sizes 1.000 cup and cubes (or 42.00g): |
| 0 mg (0%) | 121.8 kcal (6%) | 22.89 g (18%) | 1.68 g (3%) | 3.78 g (7%) | |
| Other serving sizes 1.000 slice and large (or 27.00g): |
| 0 mg (0%) | 78.3 kcal (4%) | 14.72 g (11%) | 1.08 g (2%) | 2.43 g (4%) | |
| Other serving sizes 1.000 slice crust not eaten (or 11.00g): |
| 0 mg (0%) | 31.9 kcal (2%) | 6 g (5%) | 0.44 g (1%) | 0.99 g (2%) | |
| Other serving sizes 1.000 slice and thin (or 17.00g): |
| 0 mg (0%) | 49.3 kcal (2%) | 9.27 g (7%) | 0.68 g (1%) | 1.53 g (3%) | |
| Other serving sizes 1.000 slice thin and crust not eaten (or 8.00g): |
| 0 mg (0%) | 23.2 kcal (1%) | 4.36 g (3%) | 0.32 g (0%) | 0.72 g (1%) | |
| Other serving sizes 1.000 slice and very thin (or 13.00g): |
| 0 mg (0%) | 37.7 kcal (2%) | 7.09 g (5%) | 0.52 g (1%) | 1.17 g (2%) | |
| Other serving sizes 1.000 slice (or 22.00g): |
| 0 mg (0%) | 63.8 kcal (3%) | 11.99 g (9%) | 0.88 g (1%) | 1.98 g (4%) | |
| 35. Bread, whole-wheat, commercially prepared - Vitamin C |
| Nutritional Value : 15.00 / 100 food group - Baked Products |
| Vitamin C | Energy | Carbohydrate | Total Fat | Protein |
| Profile for a 100g serving : |
| 0.00 mg (0%) | 252.00 kcal (13%) | 42.71 g (33%) | 3.50 g (5%) | 12.45 g (22%) | |
| Typical Serving size of 1.000 slice (or 32.00g): |
| 0 mg (0%) | 80.64 kcal (4%) | 13.67 g (11%) | 1.12 g (2%) | 3.98 g (7%) | |
| Other serving sizes 1.000 oz (or 28.35g): |
| 0 mg (0%) | 71.44 kcal (4%) | 12.11 g (9%) | 0.99 g (2%) | 3.53 g (6%) | |
| 36. Bread, cinnamon - Vitamin C |
| Nutritional Value : 14.00 / 100 food group - Baked Products |
| Vitamin C | Energy | Carbohydrate | Total Fat | Protein |
| Profile for a 100g serving : |
| 0.00 mg (0%) | 253.00 kcal (13%) | 44.38 g (34%) | 5.29 g (8%) | 7.05 g (13%) | |
| Typical Serving size of 1.000 slice 1 serving (or 28.00g): |
| 0 mg (0%) | 70.84 kcal (4%) | 12.43 g (10%) | 1.48 g (2%) | 1.97 g (4%) | |
| 37. Bread, rice bran - Vitamin C |
| Nutritional Value : 15.00 / 100 food group - Baked Products |
| Vitamin C | Energy | Carbohydrate | Total Fat | Protein |
| Profile for a 100g serving : |
| 0.00 mg (0%) | 243.00 kcal (12%) | 43.50 g (33%) | 4.60 g (7%) | 8.90 g (16%) | |
| Typical Serving size of 1.000 oz (or 28.35g): |
| 0 mg (0%) | 68.89 kcal (3%) | 12.33 g (9%) | 1.3 g (2%) | 2.52 g (5%) | |
| Other serving sizes 1.000 slice (or 27.00g): |
| 0 mg (0%) | 65.61 kcal (3%) | 11.75 g (9%) | 1.24 g (2%) | 2.4 g (4%) | |
| 38. Bread, white, prepared from recipe, made with nonfat dry milk - Vitamin C |
| Nutritional Value : 14.00 / 100 food group - Baked Products |
| Vitamin C | Energy | Carbohydrate | Total Fat | Protein |
| Profile for a 100g serving : |
| 0.00 mg (0%) | 274.00 kcal (14%) | 53.60 g (41%) | 2.60 g (4%) | 7.70 g (14%) | |
| Typical Serving size of 1.000 oz (or 28.35g): |
| 0 mg (0%) | 77.68 kcal (4%) | 15.2 g (12%) | 0.74 g (1%) | 2.18 g (4%) | |
| Other serving sizes 1.000 slice (or 44.00g): |
| 0 mg (0%) | 120.56 kcal (6%) | 23.58 g (18%) | 1.14 g (2%) | 3.39 g (6%) | |
| 39. Bread, whole-wheat, prepared from recipe, toasted - Vitamin C |
| Nutritional Value : 15.00 / 100 food group - Baked Products |
| Vitamin C | Energy | Carbohydrate | Total Fat | Protein |
| Profile for a 100g serving : |
| 0.00 mg (0%) | 305.00 kcal (15%) | 56.40 g (43%) | 5.90 g (9%) | 9.20 g (16%) | |
| Typical Serving size of 1.000 oz (or 28.35g): |
| 0 mg (0%) | 86.47 kcal (4%) | 15.99 g (12%) | 1.67 g (3%) | 2.61 g (5%) | |
| Other serving sizes 1.000 slice (or 42.00g): |
| 0 mg (0%) | 128.1 kcal (6%) | 23.69 g (18%) | 2.48 g (4%) | 3.86 g (7%) | |
| Other serving sizes 1.000 slice and thin (3-3/4" x 5" x 3/8") (or 30.00g): |
| 0 mg (0%) | 91.5 kcal (5%) | 16.92 g (13%) | 1.77 g (3%) | 2.76 g (5%) | |
| 40. Bread sticks, plain - Vitamin C |
| Nutritional Value : 14.00 / 100 food group - Baked Products |
| Vitamin C | Energy | Carbohydrate | Total Fat | Protein |
| Profile for a 100g serving : |
| 0.00 mg (0%) | 412.00 kcal (21%) | 68.40 g (53%) | 9.50 g (15%) | 12.00 g (21%) | |
| Typical Serving size of 1.000 cup and small pieces (or 46.00g): |
| 0 mg (0%) | 189.52 kcal (9%) | 31.46 g (24%) | 4.37 g (7%) | 5.52 g (10%) | |
| Other serving sizes 1.000 stick and small (approx 4-1/4" long) (or 5.00g): |
| 0 mg (0%) | 20.6 kcal (1%) | 3.42 g (3%) | 0.48 g (1%) | 0.6 g (1%) | |
| Other serving sizes 1.000 stick (7-5/8" x 5/8") (or 10.00g): |
| 0 mg (0%) | 41.2 kcal (2%) | 6.84 g (5%) | 0.95 g (1%) | 1.2 g (2%) | |
| Other serving sizes 1.000 stick (9-1/4" x 3/8") (or 6.00g): |
| 0 mg (0%) | 24.72 kcal (1%) | 4.1 g (3%) | 0.57 g (1%) | 0.72 g (1%) | |
| 41. Bread, cracked-wheat - Vitamin C |
| Nutritional Value : 14.00 / 100 food group - Baked Products |
| Vitamin C | Energy | Carbohydrate | Total Fat | Protein |
| Profile for a 100g serving : |
| 0.00 mg (0%) | 260.00 kcal (13%) | 49.50 g (38%) | 3.90 g (6%) | 8.70 g (16%) | |
| Typical Serving size of 1.000 oz (or 28.35g): |
| 0 mg (0%) | 73.71 kcal (4%) | 14.03 g (11%) | 1.11 g (2%) | 2.47 g (4%) | |
| Other serving sizes 1.000 cubic inch (or 3.20g): |
| 0 mg (0%) | 8.32 kcal (0%) | 1.58 g (1%) | 0.12 g (0%) | 0.28 g (1%) | |
| Other serving sizes 1.000 slice and large or thick (or 30.00g): |
| 0 mg (0%) | 78 kcal (4%) | 14.85 g (11%) | 1.17 g (2%) | 2.61 g (5%) | |
| Other serving sizes 1.000 slice and regular (or 25.00g): |
| 0 mg (0%) | 65 kcal (3%) | 12.38 g (10%) | 0.98 g (2%) | 2.18 g (4%) | |
| Other serving sizes 1.000 slice regular and crust not eaten (or 12.20g): |
| 0 mg (0%) | 31.72 kcal (2%) | 6.04 g (5%) | 0.48 g (1%) | 1.06 g (2%) | |
| Other serving sizes 1.000 slice (or 25.00g): |
| 0 mg (0%) | 65 kcal (3%) | 12.38 g (10%) | 0.98 g (2%) | 2.18 g (4%) | |
| Other serving sizes 1.000 slice and thin (or 20.00g): |
| 0 mg (0%) | 52 kcal (3%) | 9.9 g (8%) | 0.78 g (1%) | 1.74 g (3%) | |
| Other serving sizes 1.000 slice thin and crust not eaten (or 9.40g): |
| 0 mg (0%) | 24.44 kcal (1%) | 4.65 g (4%) | 0.37 g (1%) | 0.82 g (1%) | |
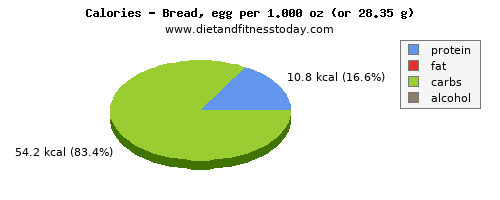
| 42. Bread, egg, toasted - Vitamin C |
| Nutritional Value : 14.00 / 100 food group - Baked Products |
| Vitamin C | Energy | Carbohydrate | Total Fat | Protein |
| Profile for a 100g serving : |
| 0.00 mg (0%) | 315.00 kcal (16%) | 52.60 g (40%) | 6.60 g (10%) | 10.50 g (19%) | |
| Typical Serving size of 1.000 oz (or 28.35g): |
| 0 mg (0%) | 89.3 kcal (4%) | 14.91 g (11%) | 1.87 g (3%) | 2.98 g (5%) | |
| Other serving sizes 1.000 slice (5" x 3" x 1/2") (or 37.00g): |
| 0 mg (0%) | 116.55 kcal (6%) | 19.46 g (15%) | 2.44 g (4%) | 3.89 g (7%) | |
| 43. Bread, pumpernickel, toasted - Vitamin C |
| Nutritional Value : 14.00 / 100 food group - Baked Products |
| Vitamin C | Energy | Carbohydrate | Total Fat | Protein |
| Profile for a 100g serving : |
| 0.00 mg (0%) | 275.00 kcal (14%) | 52.20 g (40%) | 3.40 g (5%) | 9.50 g (17%) | |
| Typical Serving size of 1.000 oz (or 28.35g): |
| 0 mg (0%) | 77.96 kcal (4%) | 14.8 g (11%) | 0.96 g (1%) | 2.69 g (5%) | |
| Other serving sizes 1.000 slice (5" x 4" x 3/8") (or 29.00g): |
| 0 mg (0%) | 79.75 kcal (4%) | 15.14 g (12%) | 0.99 g (2%) | 2.76 g (5%) | |
| 44. Bread stuffing, bread, dry mix, prepared - Vitamin C |
| Nutritional Value : 14.00 / 100 food group - Baked Products |
| Vitamin C | Energy | Carbohydrate | Total Fat | Protein |
| Profile for a 100g serving : |
| 0.00 mg (0%) | 195.00 kcal (10%) | 18.84 g (14%) | 12.05 g (19%) | 2.73 g (5%) | |
| Typical Serving size of 1.000 oz (or 28.35g): |
| 0 mg (0%) | 55.28 kcal (3%) | 5.34 g (4%) | 3.42 g (5%) | 0.77 g (1%) | |
| Other serving sizes 0.500 cup (or 100.00g): |
| 0 mg (0%) | 195 kcal (10%) | 18.84 g (14%) | 12.05 g (19%) | 2.73 g (5%) | |
| 45. Bread, french or vienna, whole wheat - Vitamin C |
| Nutritional Value : 15.00 / 100 food group - Baked Products |
| Vitamin C | Energy | Carbohydrate | Total Fat | Protein |
| Profile for a 100g serving : |
| 0.00 mg (0%) | 239.00 kcal (12%) | 49.10 g (38%) | 1.04 g (2%) | 8.33 g (15%) | |
| Typical Serving size of 1.000 slice 1 serving (or 48.00g): |
| 0 mg (0%) | 114.72 kcal (6%) | 23.57 g (18%) | 0.5 g (1%) | 4 g (7%) | |
| 46. Bread, pita, white, unenriched - Vitamin C |
| Nutritional Value : 14.00 / 100 food group - Baked Products |
| Vitamin C | Energy | Carbohydrate | Total Fat | Protein |
| Profile for a 100g serving : |
| 0.00 mg (0%) | 275.00 kcal (14%) | 55.70 g (43%) | 1.20 g (2%) | 9.10 g (16%) | |
| Typical Serving size of 1.000 oz (or 28.35g): |
| 0 mg (0%) | 77.96 kcal (4%) | 15.79 g (12%) | 0.34 g (1%) | 2.58 g (5%) | |
| Other serving sizes 1.000 pita and large (6-1/2" dia) (or 60.00g): |
| 0 mg (0%) | 165 kcal (8%) | 33.42 g (26%) | 0.72 g (1%) | 5.46 g (10%) | |
| 47. Bread, boston brown, canned - Vitamin C |
| Nutritional Value : 15.00 / 100 food group - Baked Products |
| Vitamin C | Energy | Carbohydrate | Total Fat | Protein |
| Profile for a 100g serving : |
| 0.00 mg (0%) | 195.00 kcal (10%) | 43.30 g (33%) | 1.50 g (2%) | 5.20 g (9%) | |
| Typical Serving size of 1.000 oz (or 28.35g): |
| 0 mg (0%) | 55.28 kcal (3%) | 12.28 g (9%) | 0.43 g (1%) | 1.47 g (3%) | |
| Other serving sizes 1.000 slice (or 45.00g): |
| 0 mg (0%) | 87.75 kcal (4%) | 19.49 g (15%) | 0.68 g (1%) | 2.34 g (4%) | |
| 48. Bread, oat bran - Vitamin C |
| Nutritional Value : 15.00 / 100 food group - Baked Products |
| Vitamin C | Energy | Carbohydrate | Total Fat | Protein |
| Profile for a 100g serving : |
| 0.00 mg (0%) | 236.00 kcal (12%) | 39.80 g (31%) | 4.40 g (7%) | 10.40 g (19%) | |
| Typical Serving size of 1.000 oz (or 28.35g): |
| 0 mg (0%) | 66.91 kcal (3%) | 11.28 g (9%) | 1.25 g (2%) | 2.95 g (5%) | |
| Other serving sizes 1.000 slice (or 30.00g): |
| 0 mg (0%) | 70.8 kcal (4%) | 11.94 g (9%) | 1.32 g (2%) | 3.12 g (6%) | |
| 49. Bread, whole-wheat, prepared from recipe - Vitamin C |
| Nutritional Value : 15.00 / 100 food group - Baked Products |
| Vitamin C | Energy | Carbohydrate | Total Fat | Protein |
| Profile for a 100g serving : |
| 0.00 mg (0%) | 278.00 kcal (14%) | 51.40 g (40%) | 5.40 g (8%) | 8.40 g (15%) | |
| Typical Serving size of 1.000 oz (or 28.35g): |
| 0 mg (0%) | 78.81 kcal (4%) | 14.57 g (11%) | 1.53 g (2%) | 2.38 g (4%) | |
| Other serving sizes 1.000 slice and regular (4" x 5" x 3/4") (or 46.00g): |
| 0 mg (0%) | 127.88 kcal (6%) | 23.64 g (18%) | 2.48 g (4%) | 3.86 g (7%) | |
| Other serving sizes 1.000 slice and thin (3-3/4" x 5" x 3/8") (or 33.00g): |
| 0 mg (0%) | 91.74 kcal (5%) | 16.96 g (13%) | 1.78 g (3%) | 2.77 g (5%) | |
| 50. Bread, rice bran, toasted - Vitamin C |
| Nutritional Value : 15.00 / 100 food group - Baked Products |
| Vitamin C | Energy | Carbohydrate | Total Fat | Protein |
| Profile for a 100g serving : |
| 0.00 mg (0%) | 264.00 kcal (13%) | 47.30 g (36%) | 5.00 g (8%) | 9.70 g (17%) | |
| Typical Serving size of 1.000 oz (or 28.35g): |
| 0 mg (0%) | 74.84 kcal (4%) | 13.41 g (10%) | 1.42 g (2%) | 2.75 g (5%) | |
| Other serving sizes 1.000 slice (or 25.00g): |
| 0 mg (0%) | 66 kcal (3%) | 11.83 g (9%) | 1.25 g (2%) | 2.43 g (4%) | |
| 51. Bread, protein (includes gluten) - Vitamin C |
| Nutritional Value : 15.00 / 100 food group - Baked Products |
| Vitamin C | Energy | Carbohydrate | Total Fat | Protein |
| Profile for a 100g serving : |
| 0.00 mg (0%) | 245.00 kcal (12%) | 43.80 g (34%) | 2.20 g (3%) | 12.10 g (22%) | |
| Typical Serving size of 1.000 oz (or 28.35g): |
| 0 mg (0%) | 69.46 kcal (3%) | 12.42 g (10%) | 0.62 g (1%) | 3.43 g (6%) | |
| Other serving sizes 1.000 slice (or 19.00g): |
| 0 mg (0%) | 46.55 kcal (2%) | 8.32 g (6%) | 0.42 g (1%) | 2.3 g (4%) | |
| 52. Bread crumbs, dry, grated, plain - Vitamin C |
| Nutritional Value : 14.00 / 100 food group - Baked Products |
| Vitamin C | Energy | Carbohydrate | Total Fat | Protein |
| Profile for a 100g serving : |
| 0.00 mg (0%) | 395.00 kcal (20%) | 71.98 g (55%) | 5.30 g (8%) | 13.35 g (24%) | |
| Typical Serving size of 1.000 oz (or 28.35g): |
| 0 mg (0%) | 111.98 kcal (6%) | 20.41 g (16%) | 1.5 g (2%) | 3.78 g (7%) | |
| Other serving sizes 1.000 cup (or 108.00g): |
| 0 mg (0%) | 426.6 kcal (21%) | 77.74 g (60%) | 5.72 g (9%) | 14.42 g (26%) | |
| 53. Bread, salvadoran sweet cheese (quesadilla salvadorena) - Vitamin C |
| Nutritional Value : 14.00 / 100 food group - Baked Products |
| Vitamin C | Energy | Carbohydrate | Total Fat | Protein |
| Profile for a 100g serving : |
| 0.00 mg (0%) | 374.00 kcal (19%) | 47.84 g (37%) | 17.12 g (26%) | 7.12 g (13%) | |
| Typical Serving size of 1.000 serving (approximate serving size) (or 55.00g): |
| 0 mg (0%) | 205.7 kcal (10%) | 26.31 g (20%) | 9.42 g (14%) | 3.92 g (7%) | |
| Other serving sizes 1.000 cake square (average weight of whole item) (or 399.00g): |
| 0 mg (0%) | 1492.26 kcal (75%) | 190.88 g (147%) | 68.31 g (105%) | 28.41 g (51%) | |
| 54. Bread, cheese - Vitamin C |
| Nutritional Value : 14.00 / 100 food group - Baked Products |
| Vitamin C | Energy | Carbohydrate | Total Fat | Protein |
| Profile for a 100g serving : |
| 0.00 mg (0%) | 408.00 kcal (20%) | 44.83 g (34%) | 20.83 g (32%) | 10.42 g (19%) | |
| Typical Serving size of 1.000 slice (or 48.00g): |
| 0 mg (0%) | 195.84 kcal (10%) | 21.52 g (17%) | 10 g (15%) | 5 g (9%) | |
| 55. Bread, pita, white, enriched - Vitamin C |
| Nutritional Value : 14.00 / 100 food group - Baked Products |
| Vitamin C | Energy | Carbohydrate | Total Fat | Protein |
| Profile for a 100g serving : |
| 0.00 mg (0%) | 275.00 kcal (14%) | 55.70 g (43%) | 1.20 g (2%) | 9.10 g (16%) | |
| Typical Serving size of 1.000 pita and large (6-1/2" dia) (or 60.00g): |
| 0 mg (0%) | 165 kcal (8%) | 33.42 g (26%) | 0.72 g (1%) | 5.46 g (10%) | |
| Other serving sizes 1.000 pita and small (4" dia) (or 28.00g): |
| 0 mg (0%) | 77 kcal (4%) | 15.6 g (12%) | 0.34 g (1%) | 2.55 g (5%) | |
| 56. Bread, white, commercially prepared, low sodium, no salt - Vitamin C |
| Nutritional Value : 14.00 / 100 food group - Baked Products |
| Vitamin C | Energy | Carbohydrate | Total Fat | Protein |
| Profile for a 100g serving : |
| 0.00 mg (0%) | 267.00 kcal (13%) | 49.60 g (38%) | 3.60 g (6%) | 8.20 g (15%) | |
| Typical Serving size of 1.000 oz (or 28.35g): |
| 0 mg (0%) | 75.69 kcal (4%) | 14.06 g (11%) | 1.02 g (2%) | 2.32 g (4%) | |
| Other serving sizes 1.000 cup and crumbs (or 45.00g): |
| 0 mg (0%) | 120.15 kcal (6%) | 22.32 g (17%) | 1.62 g (2%) | 3.69 g (7%) | |
| Other serving sizes 1.000 cup and cubes (or 35.00g): |
| 0 mg (0%) | 93.45 kcal (5%) | 17.36 g (13%) | 1.26 g (2%) | 2.87 g (5%) | |
| Other serving sizes 1.000 slice and large (or 30.00g): |
| 0 mg (0%) | 80.1 kcal (4%) | 14.88 g (11%) | 1.08 g (2%) | 2.46 g (4%) | |
| Other serving sizes 1.000 slice (or 25.00g): |
| 0 mg (0%) | 66.75 kcal (3%) | 12.4 g (10%) | 0.9 g (1%) | 2.05 g (4%) | |
| Other serving sizes 1.000 slice and thin (or 20.00g): |
| 0 mg (0%) | 53.4 kcal (3%) | 9.92 g (8%) | 0.72 g (1%) | 1.64 g (3%) | |
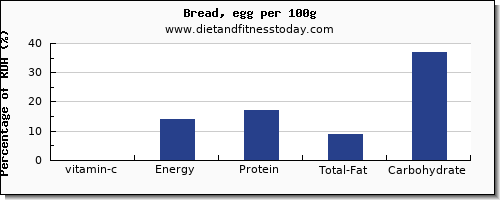
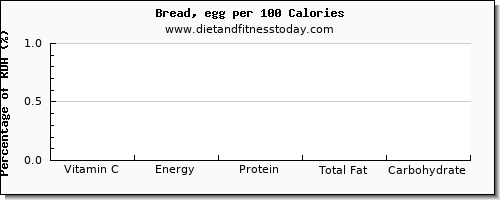
| 57. Bread, egg - Vitamin C |
| Nutritional Value : 14.00 / 100 food group - Baked Products |
| Vitamin C | Energy | Carbohydrate | Total Fat | Protein |
| Profile for a 100g serving : |
| 0.00 mg (0%) | 287.00 kcal (14%) | 47.80 g (37%) | 6.00 g (9%) | 9.50 g (17%) | |
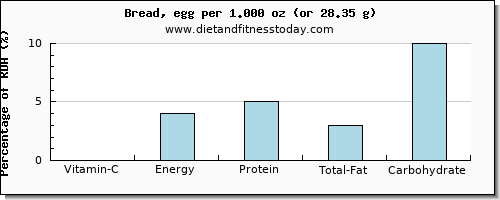
| Typical Serving size of 1.000 oz (or 28.35g): |
| 0 mg (0%) | 81.36 kcal (4%) | 13.55 g (10%) | 1.7 g (3%) | 2.69 g (5%) | |
| Other serving sizes 1.000 slice (5" x 3" x 1/2") (or 40.00g): |
| 0 mg (0%) | 114.8 kcal (6%) | 19.12 g (15%) | 2.4 g (4%) | 3.8 g (7%) | |
| 58. Bread, pita, whole-wheat - Vitamin C |
| Nutritional Value : 15.00 / 100 food group - Baked Products |
| Vitamin C | Energy | Carbohydrate | Total Fat | Protein |
| Profile for a 100g serving : |
| 0.00 mg (0%) | 262.00 kcal (13%) | 55.89 g (43%) | 1.71 g (3%) | 9.80 g (18%) | |
| Typical Serving size of 1.000 pita and large (6-1/2" dia) (or 64.00g): |
| 0 mg (0%) | 167.68 kcal (8%) | 35.77 g (28%) | 1.09 g (2%) | 6.27 g (11%) | |
| Other serving sizes 1.000 pita and small (4" dia) (or 28.00g): |
| 0 mg (0%) | 73.36 kcal (4%) | 15.65 g (12%) | 0.48 g (1%) | 2.74 g (5%) | |
| 59. Bread, pumpernickel - Vitamin C |
| Nutritional Value : 14.00 / 100 food group - Baked Products |
| Vitamin C | Energy | Carbohydrate | Total Fat | Protein |
| Profile for a 100g serving : |
| 0.00 mg (0%) | 250.00 kcal (13%) | 47.50 g (37%) | 3.10 g (5%) | 8.70 g (16%) | |
| Typical Serving size of 1.000 oz (or 28.35g): |
| 0 mg (0%) | 70.88 kcal (4%) | 13.47 g (10%) | 0.88 g (1%) | 2.47 g (4%) | |
| Other serving sizes 1.000 slice and regular (or 26.00g): |
| 0 mg (0%) | 65 kcal (3%) | 12.35 g (10%) | 0.81 g (1%) | 2.26 g (4%) | |
| Other serving sizes 1.000 slice and snack-size (or 7.00g): |
| 0 mg (0%) | 17.5 kcal (1%) | 3.33 g (3%) | 0.22 g (0%) | 0.61 g (1%) | |
| Other serving sizes 1.000 slice and thin (or 20.00g): |
| 0 mg (0%) | 50 kcal (3%) | 9.5 g (7%) | 0.62 g (1%) | 1.74 g (3%) | |
| Other serving sizes 1.000 slice (5" x 4" x 3/8") (or 32.00g): |
| 0 mg (0%) | 80 kcal (4%) | 15.2 g (12%) | 0.99 g (2%) | 2.78 g (5%) | |
| 60. Bread, reduced-calorie, oat bran, toasted - Vitamin C |
| Nutritional Value : 15.00 / 100 food group - Baked Products |
| Vitamin C | Energy | Carbohydrate | Total Fat | Protein |
| Profile for a 100g serving : |
| 0.00 mg (0%) | 239.00 kcal (12%) | 49.20 g (38%) | 3.80 g (6%) | 9.50 g (17%) | |
| Typical Serving size of 1.000 oz (or 28.35g): |
| 0 mg (0%) | 67.76 kcal (3%) | 13.95 g (11%) | 1.08 g (2%) | 2.69 g (5%) | |
| Other serving sizes 1.000 slice (or 19.00g): |
| 0 mg (0%) | 45.41 kcal (2%) | 9.35 g (7%) | 0.72 g (1%) | 1.81 g (3%) | |
| 61. Bread, italian - Vitamin C |
| Nutritional Value : 14.00 / 100 food group - Baked Products |
| Vitamin C | Energy | Carbohydrate | Total Fat | Protein |
| Profile for a 100g serving : |
| 0.00 mg (0%) | 271.00 kcal (14%) | 50.10 g (39%) | 3.50 g (5%) | 8.80 g (16%) | |
| Typical Serving size of 1.000 oz (or 28.35g): |
| 0 mg (0%) | 76.83 kcal (4%) | 14.2 g (11%) | 0.99 g (2%) | 2.49 g (4%) | |
| Other serving sizes 1.000 slice and large (4-1/2" x 3-1/4" x 3/4") (or 30.00g): |
| 0 mg (0%) | 81.3 kcal (4%) | 15.03 g (12%) | 1.05 g (2%) | 2.64 g (5%) | |
| Other serving sizes 1.000 slice and medium (or 20.00g): |
| 0 mg (0%) | 54.2 kcal (3%) | 10.02 g (8%) | 0.7 g (1%) | 1.76 g (3%) | |
| Other serving sizes 1.000 slice and small (3-1/4" x 2-1/2" x 1/2") (or 10.00g): |
| 0 mg (0%) | 27.1 kcal (1%) | 5.01 g (4%) | 0.35 g (1%) | 0.88 g (2%) | |
| 62. Bread, white wheat - Vitamin C |
| Nutritional Value : 16.00 / 100 food group - Baked Products |
| Vitamin C | Energy | Carbohydrate | Total Fat | Protein |
| Profile for a 100g serving : |
| 0.00 mg (0%) | 238.00 kcal (12%) | 43.91 g (34%) | 2.15 g (3%) | 10.66 g (19%) | |
| Typical Serving size of 1.000 slice (or 28.00g): |
| 0 mg (0%) | 66.64 kcal (3%) | 12.29 g (9%) | 0.6 g (1%) | 2.98 g (5%) | |
| 63. Bread, paratha, whole wheat, commercially prepared, frozen - Vitamin C |
| Nutritional Value : 14.00 / 100 food group - Baked Products |
| Vitamin C | Energy | Carbohydrate | Total Fat | Protein |
| Profile for a 100g serving : |
| 0.00 mg (0%) | 326.00 kcal (16%) | 45.35 g (35%) | 13.20 g (20%) | 6.36 g (11%) | |
| Typical Serving size of 1.000 piece (or 79.00g): |
| 0 mg (0%) | 257.54 kcal (13%) | 35.83 g (28%) | 10.43 g (16%) | 5.02 g (9%) | |
| 64. Bread, wheat, sprouted - Vitamin C |
| Nutritional Value : 15.00 / 100 food group - Baked Products |
| Vitamin C | Energy | Carbohydrate | Total Fat | Protein |
| Profile for a 100g serving : |
| 0.00 mg (0%) | 188.00 kcal (9%) | 33.88 g (26%) | 0.00 g (0%) | 13.16 g (24%) | |
| Typical Serving size of 1.000 slice 1 serving (or 38.00g): |
| 0 mg (0%) | 71.44 kcal (4%) | 12.87 g (10%) | 0 g (0%) | 5 g (9%) | |
| 65. Bread, white, commercially prepared (includes soft bread crumbs) - Vitamin C |
| Nutritional Value : 14.00 / 100 food group - Baked Products |
| Vitamin C | Energy | Carbohydrate | Total Fat | Protein |
| Profile for a 100g serving : |
| 0.00 mg (0%) | 266.00 kcal (13%) | 49.42 g (38%) | 3.33 g (5%) | 8.85 g (16%) | |
| Typical Serving size of 1.000 slice (or 29.00g): |
| 0 mg (0%) | 77.14 kcal (4%) | 14.33 g (11%) | 0.97 g (1%) | 2.57 g (5%) | |
| Other serving sizes 1.000 oz (or 28.35g): |
| 0 mg (0%) | 75.41 kcal (4%) | 14.01 g (11%) | 0.94 g (1%) | 2.51 g (4%) | |
| Other serving sizes 1.000 cup and crumbs (or 45.00g): |
| 0 mg (0%) | 119.7 kcal (6%) | 22.24 g (17%) | 1.5 g (2%) | 3.98 g (7%) | |
| Other serving sizes 1.000 cup and cubes (or 35.00g): |
| 0 mg (0%) | 93.1 kcal (5%) | 17.3 g (13%) | 1.17 g (2%) | 3.1 g (6%) | |
| Other serving sizes 1.000 slice and large (or 30.00g): |
| 0 mg (0%) | 79.8 kcal (4%) | 14.83 g (11%) | 1 g (2%) | 2.66 g (5%) | |
| Other serving sizes 1.000 slice (or 25.00g): |
| 0 mg (0%) | 66.5 kcal (3%) | 12.36 g (10%) | 0.83 g (1%) | 2.21 g (4%) | |
| Other serving sizes 1.000 slice crust not eaten (or 12.00g): |
| 0 mg (0%) | 31.92 kcal (2%) | 5.93 g (5%) | 0.4 g (1%) | 1.06 g (2%) | |
| Other serving sizes 1.000 slice and thin (or 20.00g): |
| 0 mg (0%) | 53.2 kcal (3%) | 9.88 g (8%) | 0.67 g (1%) | 1.77 g (3%) | |
| Other serving sizes 1.000 slice thin and crust not eaten (or 9.00g): |
| 0 mg (0%) | 23.94 kcal (1%) | 4.45 g (3%) | 0.3 g (0%) | 0.8 g (1%) | |
| Other serving sizes 1.000 slice and very thin (or 15.00g): |
| 0 mg (0%) | 39.9 kcal (2%) | 7.41 g (6%) | 0.5 g (1%) | 1.33 g (2%) | |
| 66. Bread stuffing, bread, dry mix - Vitamin C |
| Nutritional Value : 14.00 / 100 food group - Baked Products |
| Vitamin C | Energy | Carbohydrate | Total Fat | Protein |
| Profile for a 100g serving : |
| 0.00 mg (0%) | 386.00 kcal (19%) | 76.20 g (59%) | 3.40 g (5%) | 11.00 g (20%) | |
| Typical Serving size of 1.000 oz (or 28.35g): |
| 0 mg (0%) | 109.43 kcal (5%) | 21.6 g (17%) | 0.96 g (1%) | 3.12 g (6%) | |
| Other serving sizes 1.000 package (6 oz) (or 170.00g): |
| 0 mg (0%) | 656.2 kcal (33%) | 129.54 g (100%) | 5.78 g (9%) | 18.7 g (33%) | |
| 67. Bread, wheat, sprouted, toasted - Vitamin C |
| Nutritional Value : 15.00 / 100 food group - Baked Products |
| Vitamin C | Energy | Carbohydrate | Total Fat | Protein |
| Profile for a 100g serving : |
| 0.00 mg (0%) | 205.00 kcal (10%) | 36.82 g (28%) | 0.00 g (0%) | 14.30 g (26%) | |
| Typical Serving size of 1.000 slice 1 serving (or 38.00g): |
| 0 mg (0%) | 77.9 kcal (4%) | 13.99 g (11%) | 0 g (0%) | 5.43 g (10%) | |
| 68. Bread, gluten-free, white, made with rice flour, corn starch, and/or tapioca - Vitamin C |
| Nutritional Value : 14.00 / 100 food group - Baked Products |
| Vitamin C | Energy | Carbohydrate | Total Fat | Protein |
| Profile for a 100g serving : |
| 0.00 mg (0%) | 248.00 kcal (12%) | 45.78 g (35%) | 5.24 g (8%) | 4.31 g (8%) | |
| Typical Serving size of 1.000 slice (or 35.00g): |
| 0 mg (0%) | 86.8 kcal (4%) | 16.02 g (12%) | 1.83 g (3%) | 1.51 g (3%) | |
| 69. Bread, french or vienna (includes sourdough) - Vitamin C |
| Nutritional Value : 14.00 / 100 food group - Baked Products |
| Vitamin C | Energy | Carbohydrate | Total Fat | Protein |
| Profile for a 100g serving : |
| 0.00 mg (0%) | 272.00 kcal (14%) | 51.88 g (40%) | 2.42 g (4%) | 10.75 g (19%) | |
| Typical Serving size of 1.000 oz (or 28.35g): |
| 0 mg (0%) | 77.11 kcal (4%) | 14.71 g (11%) | 0.69 g (1%) | 3.05 g (5%) | |
| Other serving sizes 1.000 slice (or 139.00g): |
| 0 mg (0%) | 378.08 kcal (19%) | 72.11 g (55%) | 3.36 g (5%) | 14.94 g (27%) | |
| 70. Bread, potato - Vitamin C |
| Nutritional Value : 15.00 / 100 food group - Baked Products |
| Vitamin C | Energy | Carbohydrate | Total Fat | Protein |
| Profile for a 100g serving : |
| 0.00 mg (0%) | 266.00 kcal (13%) | 47.07 g (36%) | 3.13 g (5%) | 12.50 g (22%) | |
| Typical Serving size of 1.000 slice (or 32.00g): |
| 0 mg (0%) | 85.12 kcal (4%) | 15.06 g (12%) | 1 g (2%) | 4 g (7%) | |
| 71. Bread, reduced-calorie, oat bran - Vitamin C |
| Nutritional Value : 15.00 / 100 food group - Baked Products |
| Vitamin C | Energy | Carbohydrate | Total Fat | Protein |
| Profile for a 100g serving : |
| 0.00 mg (0%) | 201.00 kcal (10%) | 41.30 g (32%) | 3.20 g (5%) | 8.00 g (14%) | |
| Typical Serving size of 1.000 oz (or 28.35g): |
| 0 mg (0%) | 56.98 kcal (3%) | 11.71 g (9%) | 0.91 g (1%) | 2.27 g (4%) | |
| Other serving sizes 1.000 slice (or 23.00g): |
| 0 mg (0%) | 46.23 kcal (2%) | 9.5 g (7%) | 0.74 g (1%) | 1.84 g (3%) | |
| 72. Bread, protein, (includes gluten), toasted - Vitamin C |
| Nutritional Value : 15.00 / 100 food group - Baked Products |
| Vitamin C | Energy | Carbohydrate | Total Fat | Protein |
| Profile for a 100g serving : |
| 0.00 mg (0%) | 270.00 kcal (14%) | 48.10 g (37%) | 2.40 g (4%) | 13.20 g (24%) | |
| Typical Serving size of 1.000 oz (or 28.35g): |
| 0 mg (0%) | 76.55 kcal (4%) | 13.64 g (10%) | 0.68 g (1%) | 3.74 g (7%) | |
| Other serving sizes 1.000 slice (or 17.00g): |
| 0 mg (0%) | 45.9 kcal (2%) | 8.18 g (6%) | 0.41 g (1%) | 2.24 g (4%) | |
| 73. Bread, naan, whole wheat, commercially prepared, refrigerated - Vitamin C |
| Nutritional Value : 14.00 / 100 food group - Baked Products |
| Vitamin C | Energy | Carbohydrate | Total Fat | Protein |
| Profile for a 100g serving : |
| 0.00 mg (0%) | 286.00 kcal (14%) | 46.21 g (36%) | 6.70 g (10%) | 10.20 g (18%) | |
| Typical Serving size of 1.000 piece (or 106.00g): |
| 0 mg (0%) | 303.16 kcal (15%) | 48.98 g (38%) | 7.1 g (11%) | 10.81 g (19%) | |
| 74. Bread, wheat bran - Vitamin C |
| Nutritional Value : 14.00 / 100 food group - Baked Products |
| Vitamin C | Energy | Carbohydrate | Total Fat | Protein |
| Profile for a 100g serving : |
| 0.00 mg (0%) | 248.00 kcal (12%) | 47.80 g (37%) | 3.40 g (5%) | 8.80 g (16%) | |
| Typical Serving size of 1.000 oz (or 28.35g): |
| 0 mg (0%) | 70.31 kcal (4%) | 13.55 g (10%) | 0.96 g (1%) | 2.49 g (4%) | |
| Other serving sizes 1.000 slice (or 36.00g): |
| 0 mg (0%) | 89.28 kcal (4%) | 17.21 g (13%) | 1.22 g (2%) | 3.17 g (6%) | |
| 75. Bread, whole-wheat, commercially prepared, toasted - Vitamin C |
| Nutritional Value : 15.00 / 100 food group - Baked Products |
| Vitamin C | Energy | Carbohydrate | Total Fat | Protein |
| Profile for a 100g serving : |
| 0.00 mg (0%) | 306.00 kcal (15%) | 51.16 g (39%) | 4.07 g (6%) | 16.27 g (29%) | |
| Typical Serving size of 1.000 oz (or 28.35g): |
| 0 mg (0%) | 86.75 kcal (4%) | 14.5 g (11%) | 1.15 g (2%) | 4.61 g (8%) | |