Welcome to the nutritional vitamin c content in 28 different types of pie, ranging from 5.90 mg to 0.00 mg per 100g. The basic type of pie is Pie, peach, where the amount of vitamin c in 100g is 0.90 mg. 0.90 mg of vitamin c per 100g, from Pie, peach corresponds to 2% of the vitamin c RDA. For a typical serving size of 1.000 oz (or 28.35 g) the amount of Vitamin C is 0.26 mg. This corresponds to an RDA percentage of 0%.
The percentage of the recommended daily allowance (RDA) for vitamin c is based on a 60 mg RDA level for a mature adult.
Top twenty pie products high in vitamin c
Below is a summary list for the top twenty pie items ranked by the amount or level of vitamin c in 100g.
1. Pie, mince, prepared from recipe : 5.90mg (10%RDA)
2. Pie, Dutch Apple, Commercially Prepared : 5.70mg (10%RDA)
3. Pie, lemon meringue, prepared from recipe : 3.30mg (6%RDA)
4. Pie, apple, commercially prepared, enriched flour : 3.20mg (5%RDA)
5. Pie, apple, commercially prepared, unenriched flour : 3.20mg (5%RDA)
6. Pie, lemon meringue, commercially prepared : 3.20mg (5%RDA)
7. Pie, blueberry, commercially prepared : 2.70mg (5%RDA)
8. Pie, apple, prepared from recipe : 1.70mg (3%RDA)
9. Pie, pumpkin, prepared from recipe : 1.70mg (3%RDA)
10. Pie, banana cream, prepared from recipe : 1.60mg (3%RDA)
11. Pie, fried pies, fruit : 1.30mg (2%RDA)
12. Pie, fried pies, cherry : 1.30mg (2%RDA)
13. Pie, cherry, prepared from recipe : 1.00mg (2%RDA)
14. Pie, cherry, commercially prepared : 0.90mg (2%RDA)
15. Pie, peach : 0.90mg (2%RDA)
16. Pie, blueberry, prepared from recipe : 0.70mg (1%RDA)
17. Pie, coconut cream, prepared from mix, no-bake type : 0.60mg (1%RDA)
18. Pie, coconut custard, commercially prepared : 0.60mg (1%RDA)
19. Pie, egg custard, commercially prepared : 0.60mg (1%RDA)
20. Pie, banana cream, prepared from mix, no-bake type : 0.50mg (1%RDA)
Following on from the twenty top pie items or products containing vitamin c we have a more comprehensive break down of Pie, peach, and the highest item containing vitamin c which is Pie, mince, prepared from recipe. We also give a comparison of average values, median values and lowest values along with a comparison with other food groups and assess the effects of storage and preparation on the 28 types of pie.
At the bottom of the page is the full list for the 28 different types of pie based on the content in different servings in grams and oz (and other serving sizes), providing a comprehensive analysis of the vitamin c content in pie.
Pie, peach - Nutritional Content and Chart
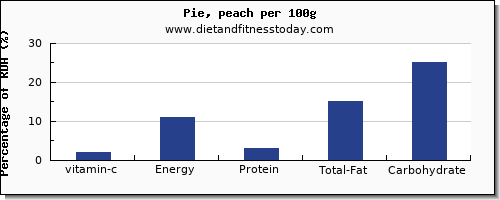
The full nutrition content, RDA percentages and levels for Pie, peach should be considered along with the vitamin c content. This food profile is part of our list of food and drinks under the general group Baked Products.Other important and vitamin c related nutrients are Energy, Protein, Total Fat and Carbohydrate. For this 100g serving in your diet, the amount of Energy is 224.00 kcal (11% RDA), the amount of Protein is 1.90 g (3% RDA), the amount of Total Fat is 10.00 g (15% RDA) and the amount of Carbohydrate is 32.90 g (25% RDA). The nutritional content and facts for 100g, which includes Energy, Protein, Total Fat and Carbohydrate is shown in the RDA chart below as percentages of the recommended daily allowance along with the vitamin c levels in pie.
Our proprietary nutritional density score gives a nutritional value out of 100 based on 9 different vitamins, minerals and macro nutrients. Pie, peach has a nutritional value score of 14.00 out of 100.Comparing the vitamin c content and the nutritional density in 100g for Pie, peach; We class this as a medium to low vitamin c content item.In terms of overall nutritional value we class this as an item with a medium nutritional density value.
Amount of vitamin c per 100 Calories
100 calories of pie, peach is a serving size of 0 g, and the amount of Vitamin C is 0 mg (0% RDA). Other important and related nutrients and macronutrients such as Total Fat, in 100 Calories are as follows; Energy 0 kcal (0% RDA), Protein 0 g (0% RDA), Total Fat 0 g (0% RDA), Carbohydrate 0 g (0% RDA). This is shown in the vitamin c RDA percentage chart below, based on 100 Calories, along with the other important nutrients and macro nutrients.
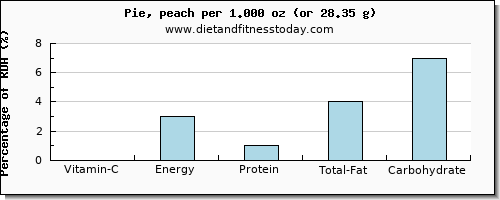
Content per Typical Serving Size 1.000 oz (or 28.35 g)
For the food Pie, peach the typical serving size is 1.000 oz (or 28.35 g) which contains 0.26 mg of Vitamin C. In terms of the gram weight and total content for this serving the Energy content is 63.5 kcal, the Protein content is 0.54 g, the Total Fat content is 2.84 g and the Carbohydrate content is 9.33 g. The percentages are shown below in the
vitamin c chart, for the typical serving of vitamin c and the related and important nutritional values.
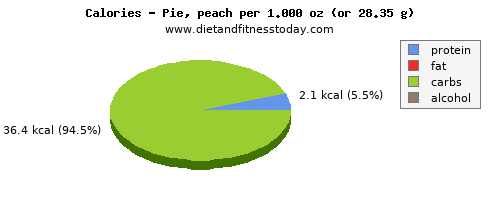
Macronutrients in Pie, peach
The amount of protein, fat and carbs from this food described above is measured in grams per 100g and grams in a typical serving size (in this case 1.000 oz or 28.35 g), although it is also useful to give the number of calories from protein, fat and carbohydrate which are the most important macronutrients. For this serving in your diet here are the macronutrient calories. From protein the number of calories is 2.1 (kcal).The total calories from carbohydrate is 36.4 (kcal).
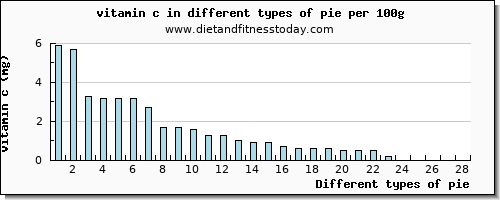
Milligrams of vitamin c in pie (per 100g)
This list of 28 types of pie, is brought to you by www.dietandfitnesstoday.com and ranges from Pie, mince, prepared from recipe through to Pie, coconut creme, commercially prepared where all food items are ranked by the content or amount per 100g. The nutritional vitamin c content can be scaled by the amount in grams, oz or typical serving sizes. Simply click on a food item or beverage from the list at the bottom of the page to give a full dietary nutritional breakdown to answer the question how much vitamin c in pie.
The list below gives the total vitamin c content in the 28 items from the general description 'pie' each of which show the vitamin c amount as well as Energy, Protein, Total Fat and Carbohydrate. Below, is the top 28 food items shown in the vitamin c chart. This gives a quick and easy dietary comparison for the different items, where each item is listed at the bottom of the page with a nutritional summary.
The corresponding nutritional value for pie based on our density score out of 100 (ranked by the amount of vitamin c per 100g) is shown in the below nutritional density chart. 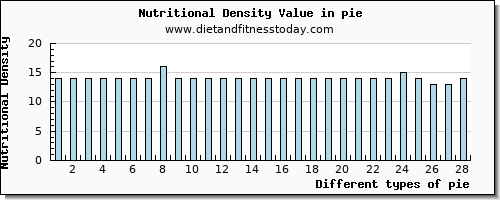
The corresponding Calories for pie ranked by the amount of vitamin c per 100g is shown below in the pie calories chart. 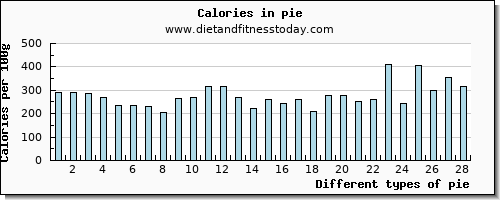
Average Content for pie
The average (or more correctly the arithmetic mean) amount of vitamin c contained in 100g of pie, based on the list below of 28 different items under the general description of pie, is 1.49 mg of vitamin c. This average value corresponds to 2.48 % of the recommended dietary allowance (or RDA) in your diet. The averages for the different nutrients are as follows; the average amount of Energy is 277.54 kcal, the average amount of Protein is 3.24 g, the average amount of Total Fat is 13.48 g and the average amount of Carbohydrate is g.
Median Amount
The median value of Vitamin C is found in Pie, cherry, commercially prepared which in 100g contains 0.90 mg of Vitamin C. This corresponds to 2 % of the recommended daily allowance. For this serving the amount of Energy is 260.00 kcal, the amount of Protein is 2.00 g, the amount of Total Fat is 11.00 g and the amount of Carbohydrate is 39.80 g.
Highest vitamin c Content per 100g
Using the list below for the 28 different pie nutrition entries in our database, the highest amount of vitamin c is found in Pie, mince, prepared from recipe which contains 5.90 mg of vitamin c per 100g. The associated percentage of RDA is 10 %. For this 100g serving the Energy content is 289.00 kcal, the Protein content is 2.60 g, the Total Fat content is 10.80 g, the Carbohydrate content is 48.00 g. 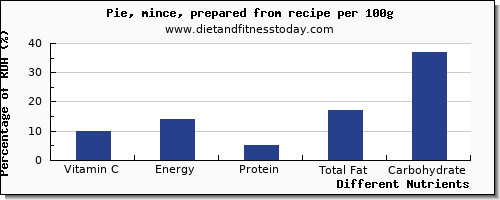
The lowest amount of vitamin c in 100g is in Pie, coconut creme, commercially prepared which contains 0.00 mg. This gives as percentage of the recommended daily allowance 0 % of the RDA. For this 100g serving the amount of Energy is 298.00 kcal, the amount of Protein is 2.10 g, the amount of Total Fat is 16.60 g, the amount of Carbohydrate is 37.30 g.
The difference between the highest and lowest values gives a vitamin c range of 5.9 mg per 100g. The range for the other nutrients are as follows; 9 kcal for Energy, 0.5 g for Protein, 5.8 g for Total Fat, 0 g for Carbohydrate.
Highest Amount of vitamin c per Serving
Please remember that the above gives an accurate value in 100g for high vitamin c foods in your diet. For example 100g of Pie, peach contains 0.90 mg of vitamin c. However, there are other factors to consider when you are assessing your nutritional requirements. You should also take into account portion sizes when you are considering the vitamin c nutritional content.
The food with the highest vitamin c content per typical serving is Pie, Dutch Apple, Commercially Prepared which contains 7.47 mg in 0.125 pie 1 pie (1/8 of 9" pie) (or 131.00 g). The percentage of the recommended daily value for this serving is 12 %. For this serving the Energy content is 379.9 kcal, the Protein content is 2.84 g, the Total Fat content is 15.07 g and the Carbohydrate content is 58.35 g.
Nutritional Information Summary
From the list below you can find a full nutrition facts breakdown for all foods containing vitamin c which can be scaled for different servings and quantities. We have also sorted our complete nutritional information and vitamin database of over 7000 foods, to give a list of
foods with a high amount of vitamin c.
Pie List, vitamin c Content per 100g
|
|
| | 1. Pie, mince, prepared from recipe - Vitamin C | | Nutritional Value : 14.00 / 100 food group - Baked Products | Vitamin C
(%RDA) | Energy
(%RDA) | Carbohydrate
(%RDA) | Total Fat
(%RDA) | Protein
(%RDA) | | Profile for a 100g serving : | | 5.90 mg (10%) | 289.00 kcal (14%) | 48.00 g (37%) | 10.80 g (17%) | 2.60 g (5%) | | | Typical Serving size of 1.000 oz (or 28.35g): | | 1.67 mg (3%) | 81.93 kcal (4%) | 13.61 g (10%) | 3.06 g (5%) | 0.74 g (1%) | | | Other serving sizes 1.000 piece (1/8 of 9" dia) (or 165.00g): | | 9.74 mg (16%) | 476.85 kcal (24%) | 79.2 g (61%) | 17.82 g (27%) | 4.29 g (8%) | | | 2. Pie, Dutch Apple, Commercially Prepared - Vitamin C | | Nutritional Value : 14.00 / 100 food group - Baked Products | | Vitamin C | Energy | Carbohydrate | Total Fat | Protein | | Profile for a 100g serving : | | 5.70 mg (10%) | 290.00 kcal (15%) | 44.54 g (34%) | 11.50 g (18%) | 2.17 g (4%) | | | Typical Serving size of 0.125 pie 1 pie (1/8 of 9" pie) (or 131.00g): | | 7.47 mg (12%) | 379.9 kcal (19%) | 58.35 g (45%) | 15.07 g (23%) | 2.84 g (5%) | | | Other serving sizes 1.000 slice (or 137.00g): | | 7.81 mg (13%) | 397.3 kcal (20%) | 61.02 g (47%) | 15.76 g (24%) | 2.97 g (5%) | | | Other serving sizes 1.000 pie (or 1137.00g): | | 64.81 mg (108%) | 3297.3 kcal (165%) | 506.42 g (390%) | 130.76 g (201%) | 24.67 g (44%) | | | Other serving sizes 1.000 oz (or 28.35g): | | 1.62 mg (3%) | 82.22 kcal (4%) | 12.63 g (10%) | 3.26 g (5%) | 0.62 g (1%) | | | 3. Pie, lemon meringue, prepared from recipe - Vitamin C | | Nutritional Value : 14.00 / 100 food group - Baked Products | | Vitamin C | Energy | Carbohydrate | Total Fat | Protein | | Profile for a 100g serving : | | 3.30 mg (6%) | 285.00 kcal (14%) | 39.10 g (30%) | 12.90 g (20%) | 3.80 g (7%) | | | Typical Serving size of 1.000 oz (or 28.35g): | | 0.94 mg (2%) | 80.8 kcal (4%) | 11.08 g (9%) | 3.66 g (6%) | 1.08 g (2%) | | | Other serving sizes 1.000 piece (1/8 of 9" dia) (or 127.00g): | | 4.19 mg (7%) | 361.95 kcal (18%) | 49.66 g (38%) | 16.38 g (25%) | 4.83 g (9%) | | | 4. Pie, apple, commercially prepared, enriched flour - Vitamin C | | Nutritional Value : 14.00 / 100 food group - Baked Products | | Vitamin C | Energy | Carbohydrate | Total Fat | Protein | | Profile for a 100g serving : | | 3.20 mg (5%) | 237.00 kcal (12%) | 34.00 g (26%) | 11.00 g (17%) | 1.90 g (3%) | | | Typical Serving size of 1.000 oz (or 28.35g): | | 0.91 mg (2%) | 67.19 kcal (3%) | 9.64 g (7%) | 3.12 g (5%) | 0.54 g (1%) | | | Other serving sizes 1.000 piece (1/8 of 9" dia) (or 125.00g): | | 4 mg (7%) | 296.25 kcal (15%) | 42.5 g (33%) | 13.75 g (21%) | 2.38 g (4%) | | | Other serving sizes 1.000 piece (1/6 of 8" pie) (or 117.00g): | | 3.74 mg (6%) | 277.29 kcal (14%) | 39.78 g (31%) | 12.87 g (20%) | 2.22 g (4%) | | | 5. Pie, apple, commercially prepared, unenriched flour - Vitamin C | | Nutritional Value : 14.00 / 100 food group - Baked Products | | Vitamin C | Energy | Carbohydrate | Total Fat | Protein | | Profile for a 100g serving : | | 3.20 mg (5%) | 237.00 kcal (12%) | 34.00 g (26%) | 11.00 g (17%) | 1.90 g (3%) | | | Typical Serving size of 1.000 oz (or 28.35g): | | 0.91 mg (2%) | 67.19 kcal (3%) | 9.64 g (7%) | 3.12 g (5%) | 0.54 g (1%) | | | Other serving sizes 1.000 piece (1/8 of 9" dia) (or 125.00g): | | 4 mg (7%) | 296.25 kcal (15%) | 42.5 g (33%) | 13.75 g (21%) | 2.38 g (4%) | | | Other serving sizes 1.000 piece (1/6 of 8" pie) (or 117.00g): | | 3.74 mg (6%) | 277.29 kcal (14%) | 39.78 g (31%) | 12.87 g (20%) | 2.22 g (4%) | | | 6. Pie, lemon meringue, commercially prepared - Vitamin C | | Nutritional Value : 14.00 / 100 food group - Baked Products | | Vitamin C | Energy | Carbohydrate | Total Fat | Protein | | Profile for a 100g serving : | | 3.20 mg (5%) | 268.00 kcal (13%) | 47.20 g (36%) | 8.70 g (13%) | 1.50 g (3%) | | | Typical Serving size of 1.000 oz (or 28.35g): | | 0.91 mg (2%) | 75.98 kcal (4%) | 13.38 g (10%) | 2.47 g (4%) | 0.43 g (1%) | | | Other serving sizes 1.000 piece (1/6 of 8" pie) (or 113.00g): | | 3.62 mg (6%) | 302.84 kcal (15%) | 53.34 g (41%) | 9.83 g (15%) | 1.7 g (3%) | | | 7. Pie, blueberry, commercially prepared - Vitamin C | | Nutritional Value : 14.00 / 100 food group - Baked Products | | Vitamin C | Energy | Carbohydrate | Total Fat | Protein | | Profile for a 100g serving : | | 2.70 mg (5%) | 232.00 kcal (12%) | 34.90 g (27%) | 10.00 g (15%) | 1.80 g (3%) | | | Typical Serving size of 1.000 oz (or 28.35g): | | 0.77 mg (1%) | 65.77 kcal (3%) | 9.89 g (8%) | 2.84 g (4%) | 0.51 g (1%) | | | Other serving sizes 1.000 piece (1/8 of 9" dia) (or 125.00g): | | 3.38 mg (6%) | 290 kcal (15%) | 43.63 g (34%) | 12.5 g (19%) | 2.25 g (4%) | | | Other serving sizes 1.000 piece (1/6 of 8" pie) (or 117.00g): | | 3.16 mg (5%) | 271.44 kcal (14%) | 40.83 g (31%) | 11.7 g (18%) | 2.11 g (4%) | | | 8. Pie, apple, prepared from recipe - Vitamin C | | Nutritional Value : 14.00 / 100 food group - Baked Products | | Vitamin C | Energy | Carbohydrate | Total Fat | Protein | | Profile for a 100g serving : | | 1.70 mg (3%) | 265.00 kcal (13%) | 37.10 g (29%) | 12.50 g (19%) | 2.40 g (4%) | | | Typical Serving size of 1.000 oz (or 28.35g): | | 0.48 mg (1%) | 75.13 kcal (4%) | 10.52 g (8%) | 3.54 g (5%) | 0.68 g (1%) | | | Other serving sizes 1.000 piece (1/8 of 9" dia) (or 155.00g): | | 2.64 mg (4%) | 410.75 kcal (21%) | 57.51 g (44%) | 19.38 g (30%) | 3.72 g (7%) | | | 9. Pie, pumpkin, prepared from recipe - Vitamin C | | Nutritional Value : 16.00 / 100 food group - Baked Products | | Vitamin C | Energy | Carbohydrate | Total Fat | Protein | | Profile for a 100g serving : | | 1.70 mg (3%) | 204.00 kcal (10%) | 26.40 g (20%) | 9.30 g (14%) | 4.50 g (8%) | | | Typical Serving size of 1.000 oz (or 28.35g): | | 0.48 mg (1%) | 57.83 kcal (3%) | 7.48 g (6%) | 2.64 g (4%) | 1.28 g (2%) | | | Other serving sizes 1.000 piece (1/8 of 9" dia) (or 155.00g): | | 2.64 mg (4%) | 316.2 kcal (16%) | 40.92 g (31%) | 14.42 g (22%) | 6.98 g (12%) | | | 10. Pie, banana cream, prepared from recipe - Vitamin C | | Nutritional Value : 14.00 / 100 food group - Baked Products | | Vitamin C | Energy | Carbohydrate | Total Fat | Protein | | Profile for a 100g serving : | | 1.60 mg (3%) | 269.00 kcal (13%) | 32.90 g (25%) | 13.60 g (21%) | 4.40 g (8%) | | | Typical Serving size of 1.000 oz (or 28.35g): | | 0.45 mg (1%) | 76.26 kcal (4%) | 9.33 g (7%) | 3.86 g (6%) | 1.25 g (2%) | | | Other serving sizes 1.000 pie (9" dia) (or 1186.00g): | | 18.98 mg (32%) | 3190.34 kcal (160%) | 390.19 g (300%) | 161.3 g (248%) | 52.18 g (93%) | | | Other serving sizes 1.000 piece (1/8 of 9" dia) (or 144.00g): | | 2.3 mg (4%) | 387.36 kcal (19%) | 47.38 g (36%) | 19.58 g (30%) | 6.34 g (11%) | | | 11. Pie, fried pies, fruit - Vitamin C | | Nutritional Value : 14.00 / 100 food group - Baked Products | | Vitamin C | Energy | Carbohydrate | Total Fat | Protein | | Profile for a 100g serving : | | 1.30 mg (2%) | 316.00 kcal (16%) | 42.60 g (33%) | 16.10 g (25%) | 3.00 g (5%) | | | Typical Serving size of 1.000 oz (or 28.35g): | | 0.37 mg (1%) | 89.59 kcal (4%) | 12.08 g (9%) | 4.56 g (7%) | 0.85 g (2%) | | | Other serving sizes 1.000 pie (5" x 3-3/4") (or 128.00g): | | 1.66 mg (3%) | 404.48 kcal (20%) | 54.53 g (42%) | 20.61 g (32%) | 3.84 g (7%) | | | 12. Pie, fried pies, cherry - Vitamin C | | Nutritional Value : 14.00 / 100 food group - Baked Products | | Vitamin C | Energy | Carbohydrate | Total Fat | Protein | | Profile for a 100g serving : | | 1.30 mg (2%) | 316.00 kcal (16%) | 42.60 g (33%) | 16.10 g (25%) | 3.00 g (5%) | | | Typical Serving size of 1.000 oz (or 28.35g): | | 0.37 mg (1%) | 89.59 kcal (4%) | 12.08 g (9%) | 4.56 g (7%) | 0.85 g (2%) | | | Other serving sizes 1.000 pie (5" x 3-3/4") (or 128.00g): | | 1.66 mg (3%) | 404.48 kcal (20%) | 54.53 g (42%) | 20.61 g (32%) | 3.84 g (7%) | | | 13. Pie, cherry, prepared from recipe - Vitamin C | | Nutritional Value : 14.00 / 100 food group - Baked Products | | Vitamin C | Energy | Carbohydrate | Total Fat | Protein | | Profile for a 100g serving : | | 1.00 mg (2%) | 270.00 kcal (14%) | 38.50 g (30%) | 12.20 g (19%) | 2.80 g (5%) | | | Typical Serving size of 1.000 oz (or 28.35g): | | 0.28 mg (0%) | 76.55 kcal (4%) | 10.91 g (8%) | 3.46 g (5%) | 0.79 g (1%) | | | Other serving sizes 1.000 piece (1/8 of 9" dia) (or 180.00g): | | 1.8 mg (3%) | 486 kcal (24%) | 69.3 g (53%) | 21.96 g (34%) | 5.04 g (9%) | | | 14. Pie, cherry, commercially prepared - Vitamin C | | Nutritional Value : 14.00 / 100 food group - Baked Products | | Vitamin C | Energy | Carbohydrate | Total Fat | Protein | | Profile for a 100g serving : | | 0.90 mg (2%) | 260.00 kcal (13%) | 39.80 g (31%) | 11.00 g (17%) | 2.00 g (4%) | | | Typical Serving size of 1.000 oz (or 28.35g): | | 0.26 mg (0%) | 73.71 kcal (4%) | 11.28 g (9%) | 3.12 g (5%) | 0.57 g (1%) | | | Other serving sizes 1.000 piece (1/8 of 9" dia) (or 125.00g): | | 1.13 mg (2%) | 325 kcal (16%) | 49.75 g (38%) | 13.75 g (21%) | 2.5 g (4%) | | | Other serving sizes 1.000 piece (1/6 of 8" pie) (or 117.00g): | | 1.05 mg (2%) | 304.2 kcal (15%) | 46.57 g (36%) | 12.87 g (20%) | 2.34 g (4%) | | | 15. Pie, peach - Vitamin C | | Nutritional Value : 14.00 / 100 food group - Baked Products | | Vitamin C | Energy | Carbohydrate | Total Fat | Protein | | Profile for a 100g serving : | | 0.90 mg (2%) | 224.00 kcal (11%) | 32.90 g (25%) | 10.00 g (15%) | 1.90 g (3%) | | | Typical Serving size of 1.000 oz (or 28.35g): | | 0.26 mg (0%) | 63.5 kcal (3%) | 9.33 g (7%) | 2.84 g (4%) | 0.54 g (1%) | | | Other serving sizes 1.000 piece (1/6 of 8" pie) (or 117.00g): | | 1.05 mg (2%) | 262.08 kcal (13%) | 38.49 g (30%) | 11.7 g (18%) | 2.22 g (4%) | | | 16. Pie, blueberry, prepared from recipe - Vitamin C | | Nutritional Value : 14.00 / 100 food group - Baked Products | | Vitamin C | Energy | Carbohydrate | Total Fat | Protein | | Profile for a 100g serving : | | 0.70 mg (1%) | 245.00 kcal (12%) | 33.50 g (26%) | 11.90 g (18%) | 2.70 g (5%) | | | Typical Serving size of 1.000 oz (or 28.35g): | | 0.2 mg (0%) | 69.46 kcal (3%) | 9.5 g (7%) | 3.37 g (5%) | 0.77 g (1%) | | | Other serving sizes 1.000 piece (1/8 of 9" dia) (or 147.00g): | | 1.03 mg (2%) | 360.15 kcal (18%) | 49.25 g (38%) | 17.49 g (27%) | 3.97 g (7%) | | | 17. Pie, coconut cream, prepared from mix, no-bake type - Vitamin C | | Nutritional Value : 14.00 / 100 food group - Baked Products | | Vitamin C | Energy | Carbohydrate | Total Fat | Protein | | Profile for a 100g serving : | | 0.60 mg (1%) | 276.00 kcal (14%) | 28.50 g (22%) | 17.60 g (27%) | 2.80 g (5%) | | | Typical Serving size of 1.000 oz (or 28.35g): | | 0.17 mg (0%) | 78.25 kcal (4%) | 8.08 g (6%) | 4.99 g (8%) | 0.79 g (1%) | | | Other serving sizes 1.000 piece (1/8 of 9" dia) (or 94.00g): | | 0.56 mg (1%) | 259.44 kcal (13%) | 26.79 g (21%) | 16.54 g (25%) | 2.63 g (5%) | | | 18. Pie, coconut custard, commercially prepared - Vitamin C | | Nutritional Value : 14.00 / 100 food group - Baked Products | | Vitamin C | Energy | Carbohydrate | Total Fat | Protein | | Profile for a 100g serving : | | 0.60 mg (1%) | 260.00 kcal (13%) | 30.20 g (23%) | 13.20 g (20%) | 5.90 g (11%) | | | Typical Serving size of 1.000 oz (or 28.35g): | | 0.17 mg (0%) | 73.71 kcal (4%) | 8.56 g (7%) | 3.74 g (6%) | 1.67 g (3%) | | | Other serving sizes 1.000 piece (1/6 of 8" pie) (or 104.00g): | | 0.62 mg (1%) | 270.4 kcal (14%) | 31.41 g (24%) | 13.73 g (21%) | 6.14 g (11%) | | | 19. Pie, egg custard, commercially prepared - Vitamin C | | Nutritional Value : 14.00 / 100 food group - Baked Products | | Vitamin C | Energy | Carbohydrate | Total Fat | Protein | | Profile for a 100g serving : | | 0.60 mg (1%) | 210.00 kcal (11%) | 20.80 g (16%) | 11.60 g (18%) | 5.50 g (10%) | | | Typical Serving size of 1.000 oz (or 28.35g): | | 0.17 mg (0%) | 59.54 kcal (3%) | 5.9 g (5%) | 3.29 g (5%) | 1.56 g (3%) | | | Other serving sizes 1.000 piece (1/6 of 8" pie) (or 105.00g): | | 0.63 mg (1%) | 220.5 kcal (11%) | 21.84 g (17%) | 12.18 g (19%) | 5.78 g (10%) | | | 20. Pie, banana cream, prepared from mix, no-bake type - Vitamin C | | Nutritional Value : 14.00 / 100 food group - Baked Products | | Vitamin C | Energy | Carbohydrate | Total Fat | Protein | | Profile for a 100g serving : | | 0.50 mg (1%) | 251.00 kcal (13%) | 31.60 g (24%) | 12.90 g (20%) | 3.40 g (6%) | | | Typical Serving size of 1.000 oz (or 28.35g): | | 0.14 mg (0%) | 71.16 kcal (4%) | 8.96 g (7%) | 3.66 g (6%) | 0.96 g (2%) | | | Other serving sizes 1.000 piece (1/8 of 9" dia) (or 92.00g): | | 0.46 mg (1%) | 230.92 kcal (12%) | 29.07 g (22%) | 11.87 g (18%) | 3.13 g (6%) | | | Other serving sizes 1.000 piece (1/6 of 8" pie) (or 123.00g): | | 0.62 mg (1%) | 308.73 kcal (15%) | 38.87 g (30%) | 15.87 g (24%) | 4.18 g (7%) | | | 21. Pie, chocolate mousse, prepared from mix, no-bake type - Vitamin C | | Nutritional Value : 14.00 / 100 food group - Baked Products | | Vitamin C | Energy | Carbohydrate | Total Fat | Protein | | Profile for a 100g serving : | | 0.50 mg (1%) | 260.00 kcal (13%) | 29.60 g (23%) | 15.40 g (24%) | 3.50 g (6%) | | | Typical Serving size of 1.000 oz (or 28.35g): | | 0.14 mg (0%) | 73.71 kcal (4%) | 8.39 g (6%) | 4.37 g (7%) | 0.99 g (2%) | | | Other serving sizes 1.000 piece (1/8 of 9" dia) (or 95.00g): | | 0.48 mg (1%) | 247 kcal (12%) | 28.12 g (22%) | 14.63 g (23%) | 3.33 g (6%) | | | 22. Pie, vanilla cream, prepared from recipe - Vitamin C | | Nutritional Value : 14.00 / 100 food group - Baked Products | | Vitamin C | Energy | Carbohydrate | Total Fat | Protein | | Profile for a 100g serving : | | 0.50 mg (1%) | 278.00 kcal (14%) | 32.60 g (25%) | 14.40 g (22%) | 4.80 g (9%) | | | Typical Serving size of 1.000 oz (or 28.35g): | | 0.14 mg (0%) | 78.81 kcal (4%) | 9.24 g (7%) | 4.08 g (6%) | 1.36 g (2%) | | | Other serving sizes 1.000 piece (1/8 of 9" dia) (or 126.00g): | | 0.63 mg (1%) | 350.28 kcal (18%) | 41.08 g (32%) | 18.14 g (28%) | 6.05 g (11%) | | | 23. Pie, pecan, prepared from recipe - Vitamin C | | Nutritional Value : 14.00 / 100 food group - Baked Products | | Vitamin C | Energy | Carbohydrate | Total Fat | Protein | | Profile for a 100g serving : | | 0.20 mg (0%) | 412.00 kcal (21%) | 52.20 g (40%) | 22.20 g (34%) | 4.90 g (9%) | | | Typical Serving size of 1.000 oz (or 28.35g): | | 0.06 mg (0%) | 116.8 kcal (6%) | 14.8 g (11%) | 6.29 g (10%) | 1.39 g (2%) | | | Other serving sizes 1.000 piece (1/8 of 9" dia) (or 122.00g): | | 0.24 mg (0%) | 502.64 kcal (25%) | 63.68 g (49%) | 27.08 g (42%) | 5.98 g (11%) | | | 24. Pie, pumpkin, commercially prepared - Vitamin C | | Nutritional Value : 15.00 / 100 food group - Baked Products | | Vitamin C | Energy | Carbohydrate | Total Fat | Protein | | Profile for a 100g serving : | | 0.00 mg (0%) | 243.00 kcal (12%) | 34.83 g (27%) | 9.75 g (15%) | 3.90 g (7%) | | | Typical Serving size of 1.000 oz (or 28.35g): | | 0 mg (0%) | 68.89 kcal (3%) | 9.87 g (8%) | 2.76 g (4%) | 1.11 g (2%) | | | Other serving sizes 1.000 slice (or 133.00g): | | 0 mg (0%) | 323.19 kcal (16%) | 46.32 g (36%) | 12.97 g (20%) | 5.19 g (9%) | | | Other serving sizes 1.000 pie (or 995.00g): | | 0 mg (0%) | 2417.85 kcal (121%) | 346.56 g (267%) | 97.01 g (149%) | 38.81 g (69%) | | | 25. Pie, pecan, commercially prepared - Vitamin C | | Nutritional Value : 14.00 / 100 food group - Baked Products | | Vitamin C | Energy | Carbohydrate | Total Fat | Protein | | Profile for a 100g serving : | | 0.00 mg (0%) | 407.00 kcal (20%) | 59.61 g (46%) | 16.69 g (26%) | 4.50 g (8%) | | | Typical Serving size of 1.000 oz (or 28.35g): | | 0 mg (0%) | 115.38 kcal (6%) | 16.9 g (13%) | 4.73 g (7%) | 1.28 g (2%) | | | Other serving sizes 1.000 slice (or 133.00g): | | 0 mg (0%) | 541.31 kcal (27%) | 79.28 g (61%) | 22.2 g (34%) | 5.99 g (11%) | | | Other serving sizes 1.000 pie (or 833.00g): | | 0 mg (0%) | 3390.31 kcal (170%) | 496.55 g (382%) | 139.03 g (214%) | 37.49 g (67%) | | | 26. Pie, chocolate creme, commercially prepared - Vitamin C | | Nutritional Value : 13.00 / 100 food group - Baked Products | | Vitamin C | Energy | Carbohydrate | Total Fat | Protein | | Profile for a 100g serving : | | 0.00 mg (0%) | 353.00 kcal (18%) | 38.44 g (30%) | 22.41 g (34%) | 4.15 g (7%) | | | Typical Serving size of 1.000 serving .167 pie (or 120.00g): | | 0 mg (0%) | 423.6 kcal (21%) | 46.13 g (35%) | 26.89 g (41%) | 4.98 g (9%) | | | Other serving sizes 1.000 oz (or 28.35g): | | 0 mg (0%) | 100.08 kcal (5%) | 10.9 g (8%) | 6.35 g (10%) | 1.18 g (2%) | | | Other serving sizes 1.000 piece (1/4 of 6" pie) (or 99.00g): | | 0 mg (0%) | 349.47 kcal (17%) | 38.06 g (29%) | 22.19 g (34%) | 4.11 g (7%) | | | Other serving sizes 1.000 piece (1/6 of 8" pie) (or 113.00g): | | 0 mg (0%) | 398.89 kcal (20%) | 43.44 g (33%) | 25.32 g (39%) | 4.69 g (8%) | | | 27. Pie, fried pies, lemon - Vitamin C | | Nutritional Value : 14.00 / 100 food group - Baked Products | | Vitamin C | Energy | Carbohydrate | Total Fat | Protein | | Profile for a 100g serving : | | 0.00 mg (0%) | 316.00 kcal (16%) | 42.60 g (33%) | 16.10 g (25%) | 3.00 g (5%) | | | Typical Serving size of 1.000 oz (or 28.35g): | | 0 mg (0%) | 89.59 kcal (4%) | 12.08 g (9%) | 4.56 g (7%) | 0.85 g (2%) | | | Other serving sizes 1.000 pie (5" x 3-3/4") (or 128.00g): | | 0 mg (0%) | 404.48 kcal (20%) | 54.53 g (42%) | 20.61 g (32%) | 3.84 g (7%) | | | 28. Pie, coconut creme, commercially prepared - Vitamin C | | Nutritional Value : 13.00 / 100 food group - Baked Products | | Vitamin C | Energy | Carbohydrate | Total Fat | Protein | | Profile for a 100g serving : | | 0.00 mg (0%) | 298.00 kcal (15%) | 37.30 g (29%) | 16.60 g (26%) | 2.10 g (4%) | | | Typical Serving size of 1.000 oz (or 28.35g): | | 0 mg (0%) | 84.48 kcal (4%) | 10.57 g (8%) | 4.71 g (7%) | 0.6 g (1%) | | | Other serving sizes 1.000 piece (1/6 of 7" pie) (or 64.00g): | | 0 mg (0%) | 190.72 kcal (10%) | 23.87 g (18%) | 10.62 g (16%) | 1.34 g (2%) | | |
vitamin c and Nutritional Values - Top 221 Foods
Vegetablesleeks, turnip greens, swiss chard, mustard greens, yams, fennel, artichokes, broccoli, cauliflower, kale, green beans, brussel sprouts, cabbage, sweet potato, a potato, carrots, lettuce, iceberg lettuce, spinach, shiitake mushrooms, celery, salad, mushrooms, potatoes, baked potato, onions, asparagus, pumpkin, radishes, taro, turnips, okra, rhubarb, sweet corn, cowpeas, seaweed, broadbeansFruitsa banana, an apple, an orange, a peach, apricots, butternut squash, lemon, grapes, watermelon, strawberries, green grapes, kiwi, blueberries, zucchini, figs, honeydew, eggplant, dates, olives, a pear, coconut, cranberries, pomegranate, a mango, pineapple, cherries, cantaloupe, grapefruit, tangerine, nectarines, raisins, plums, tomatoes, chili peppers, chilis, peppers, avocado, cucumber, summer squash, winter squash, papaya, prunes, fruit salad, persimmonsSeafoodsalmon, cod, sardines, shrimp, tuna, fish, tuna salad, halibut, sea bass, scallops, crab, lobster, oysters, herring, haddock, halibut, mackerel, pike, pollock, troutDrinkscoffee, apple juice, cranberry juice, red wine, skim milk, white wine, wine, milk, beer, alcohol, coke, soy milk, whole milk, prune juice, tea, a shake, coconut milk, orange juice, energy drinks, soft drinks, grapefruit juice, lemon juice, lemonadeNuts and Seedschia seeds, sunflower seeds, pecans, pumpkin seeds, hazelnuts, nuts, almonds, sesame seeds, walnuts, cashews, peanuts, chestnuts, coconut meat, ginkgo nuts, mixed nuts, macadamia nutsBeans and Lentilssoybeans, pinto beans, kidney beans, lentils, black beans, lima beans, navy beans, beets, beans, garbanzo beans, baked beansMeatbeef, steak, deer, bacon, chicken, fried chicken, turkey, turkey breast, chicken breast, meatloaf, ham, lamb, sausages, chicken light meat, chicken dark meat, chicken leg, fried chicken, roasted chicken, chicken thigh, chicken wings, duck, goose, pheasant, quail, pigeon, turkey light meat, turkey dark meat, turkey breast, turkey leg, turkey wing, emu, ostrich, frankfurter, pate, pork sausage, salami, bratwurst, pork loin, ground pork, lamb shank, veal, bison, beef liver, beef ribsFast Foodsfrench fries, pizza, a slice of pizza, hot dog, hamburger, a cheeseburger, a big macDairy and Cheesericotta, yogurt, cottage cheese, an egg, egg whites, goats cheese, cheddar, cheddar cheese, cheese, hard boiled egg, feta cheese, mozzarella, low fat yogurtBread, Rice, Grains and Pastarye, millet, flaxseed, barley, buckwheat, whole wheat bread, a bagel, white bread, bread, quinoa, corn, spaghetti, rice, pasta, brown rice, white rice, cooked egg, mexican cheese, fruit yogurtSpreads, Sauces and Herbshummus, mayonnaise, butter, peanut butter, soy sauce, thyme, basil, rosemary, pepper, coriander, dill, parsley, spices, chili sauceSweets, Desserts and Snackspopcorn, chips, nachos, a granola bar, saltine crackers, cheesecake, jello, ice cream, doughnuts, chocolate, puddings, frozen yogurt, a snickers bar, croissants, danish pastry, english muffins, blueberry muffins, pie, pop tarts, coffeecake, crackers, potato chips, rice cakes, tortilla chips, fudge, puddings, syrups, dark chocolate, sundae, pretzels, pop tartsBreakfast Cerealgranola, cheerios, oatmeal, kelloggs cereals, general mills cerealsMiscellaneousspirulina, honey, sugar, brown sugar, tofu, olive oil, garlic, tempeh, oats, salad dressing, tomato soup, mushroom soup, chicken soup, vegetable soup, infant formula, cooking oil, shortening, fish oil, soybean oil, soy protein, gravy, raisins, currants, balsam pear, succotash, macaroni, egg noodles, japanese noodles, macaroni and cheese, burrito |