Welcome to the nutritional density value in 28 different types of pie, ranging from 14.00 to 14.00 (out of a maximum of 100) per 100 Calories (kCal). The basic amount from the general description of pie is Pie, peach. The nutritional density score (out of 100) or nutritional value of Pie, peach is 14.00.
Top twenty pie products high in nutritional value
Below is a summary list for the top twenty pie items ranked by the amount or level of nutritional value in 100g. At the bottom of the page is the full list for the 28 different types of pie based on the content in different servings in grams and oz (and other serving sizes).
1. Pie, apple, commercially prepared, enriched flour : 14.00%
2. Pie, apple, prepared from recipe : 14.00%
3. Pie, banana cream, prepared from mix, no-bake type : 14.00%
4. Pie, banana cream, prepared from recipe : 14.00%
5. Pie, blueberry, commercially prepared : 14.00%
6. Pie, blueberry, prepared from recipe : 14.00%
7. Pie, cherry, commercially prepared : 14.00%
8. Pie, cherry, prepared from recipe : 14.00%
9. Pie, chocolate creme, commercially prepared : 13.00%
10. Pie, chocolate mousse, prepared from mix, no-bake type : 14.00%
11. Pie, coconut creme, commercially prepared : 13.00%
12. Pie, coconut cream, prepared from mix, no-bake type : 14.00%
13. Pie, coconut custard, commercially prepared : 14.00%
14. Pie, egg custard, commercially prepared : 14.00%
15. Pie, fried pies, fruit : 14.00%
16. Pie, lemon meringue, commercially prepared : 14.00%
17. Pie, lemon meringue, prepared from recipe : 14.00%
18. Pie, mince, prepared from recipe : 14.00%
19. Pie, peach : 14.00%
20. Pie, pecan, commercially prepared : 14.00%
Following on from the twenty top pie items or products containing nutritional value we have a more comprehensive break down of Pie, peach, and the highest item containing nutritional value which is Pie, apple, commercially prepared, enriched flour. Furthermore we provide a comparison of average values, median values and lowest values along with a comparison with other food groups and assess the effects of storage and preparation on pie. Our aim is to provide a comprehensive analysis of the nutritional value content in pie.
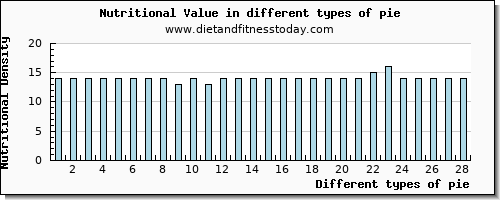
Nutritional Density Values
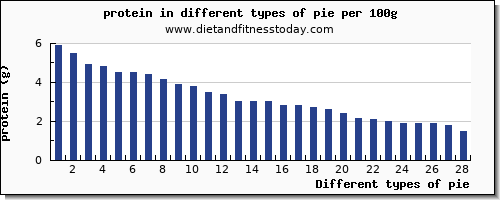
The list at thee bottom of the page gives the total nutritional score in the 28 items from the general description 'pie' each of which show the nutritional amounts as well as Energy, Protein, Total Fat, Carbohydrate, Fiber and Sugars. The top 28 food items are shown in the graph below, to give a quick and easy dietary comparison for the different items, where each item is listed at the bottom of the page with a nutritional summary.
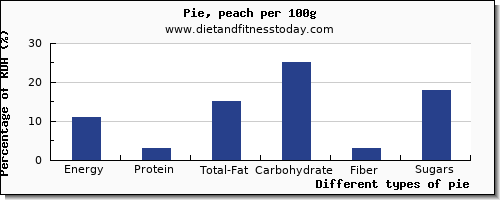
For a serving per 100g, in a diet, the amount of Energy is 224.00 kcal (11% RDA), the amount of Protein is 1.90 g (3% RDA), the amount of Total Fat is 10.00 g (15% RDA), the amount of Carbohydrate is 32.90 g (25% RDA), the amount of Fiber is 0.80 g (3% RDA) and the amount of Sugars is 16.23 g (18% RDA). The nutritional value amounts and nutrition facts for 100g is shown in the bar chart below as percentages of the recommended daily allowance.
For the food Pie, peach the typical serving size is 1.000 oz (or 28.35 g). In terms of the gram weight and total content for this serving the Energy content is 63.5 kcal, the Protein content is 0.54 g, the Total Fat content is 2.84 g, the Carbohydrate content is 9.33 g, the Fiber content is 0.23 g and the Sugars content is 4.6 g. 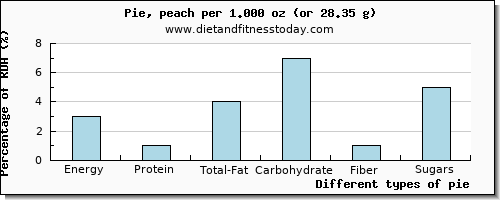
The amount of protein, fat and carbs from this food is measured as a gram weight value although it is also useful to give the calories from these macronutrients. For this serving in your diet here are the macronutrient calories. From protein the number of calories is 2.1 (kcal).The total calories from carbohydrate is 36.4 (kcal).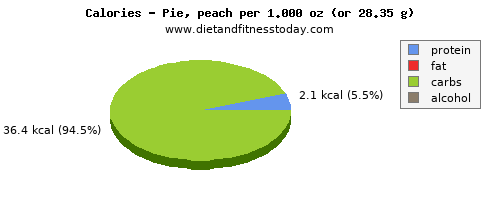
This list of 28 types of pie, is brought to you by www.dietandfitnesstoday.com and ranges from Pie, apple, commercially prepared, enriched flour through to Pie, Dutch Apple, Commercially Prepared where all food items are ranked by the nutritional value. The nutritional content can be scaled by the amount in grams, oz or typical serving sizes. Simply click on a food item or beverage from the list at the bottom of the page to give a full dietary nutritional breakdown to answer the question what is the nutritional value of pie.
Average Content for pie
The average (or more correctly the arithmetic mean) amount of nutritional value contained in 100 Calories of pie, based on the list below of 28 different items under the general description of pie, is 14.04 % of nutritional value. The averages for the different nutrients are as follows; the average amount of Energy is 277.54 kcal, the average amount of Protein is 3.24 g, the average amount of Total Fat is 13.48 g, the average amount of Carbohydrate is 37.37 g, the average amount of Fiber is 1.10 g and the average amount of Sugars is 9.93 g.
Median Amount
The median nutritional Nutrition Density value is found in Pie, egg custard, commercially prepared which in 100 Calories contains 14.00 % of Nutrition Density. For this serving the amount of Energy is 210.00 kcal, the amount of Protein is 5.50 g, the amount of Total Fat is 11.60 g, the amount of Carbohydrate is 20.80 g, the amount of Fiber is 1.60 g and the amount of Sugars is 11.58 g.
Highest Nutritional Density Content
Using the list below for the 28 different pie nutrition entries in our database, the highest amount of nutritional value is found in Pie, apple, commercially prepared, enriched flour which has a nutritional value of 14.00. For a 100g serving the Energy content is 237.00 kcal, the Protein content is 1.90 g, the Total Fat content is 11.00 g, the Carbohydrate content is 34.00 g, the Fiber content is 1.60 g, the Sugars content is 15.65 g.
The lowest nutritional value is in Pie, Dutch Apple, Commercially Prepared which has a value of 14.00 % of nutritional value. For a 100g serving the amount of Energy is 290.00 kcal, the amount of Protein is 2.17 g, the amount of Total Fat is 11.50 g, the amount of Carbohydrate is 44.54 g, the amount of Fiber is 1.60 g, the amount of Sugars is 22.02 g.
The difference between the highest and lowest values gives a nutritional value range of 0. The range for the other nutrients are as follows; 53 kcal for Energy, 0.27 g for Protein, 0.5 g for Total Fat, 10.54 g for Carbohydrate, 0 g for Fiber, 6.37 g for Sugars.
Nutritional Scores per Typical Serving
For a typical serving of 0.125 pie 1 pie (1/8 of 9" pie) (or 131.00 g) for Pie, Dutch Apple, Commercially Prepared the Energy content is 379.9 kcal, the Protein content is 2.84 g, the Total Fat content is 15.07 g, the Carbohydrate content is 58.35 g, the Fiber content is 2.1 g and the Sugars content is 28.85 g.
Nutritional Information Summary
From the list below you can find a full nutrition facts breakdown for all foods containing nutritional value which can be scaled for different servings and quantities.
List of Nutritional Values for Pie
|
|
| | 1. Pie, apple, commercially prepared, enriched flour - nutritional score 14.00 / 100 |
| Fiber
(%RDA) | Sugars
(%RDA) | Energy
(%RDA) | Carbohydrate
(%RDA) | Total Fat
(%RDA) | Protein
(%RDA) | | For a 100g serving : | | | 1.60 g (6%) | 15.65 g (17%) | 237.00 kcal (12%) | 34.00 g (26%) | 11.00 g (17%) | 1.90 g (3%) | | | Typical Serving size of 1.000 oz (or 28.35g): | | | 0.45 g (2%) | 4.44 g (5%) | 67.19 kcal (3%) | 9.64 g (7%) | 3.12 g (5%) | 0.54 g (1%) | | | Other serving sizes 1.000 piece (1/8 of 9" dia) (or 125.00g): | | | 2 g (8%) | 19.56 g (22%) | 296.25 kcal (15%) | 42.5 g (33%) | 13.75 g (21%) | 2.38 g (4%) | | | Other serving sizes 1.000 piece (1/6 of 8" pie) (or 117.00g): | | | 1.87 g (7%) | 18.31 g (20%) | 277.29 kcal (14%) | 39.78 g (31%) | 12.87 g (20%) | 2.22 g (4%) | | | 2. Pie, apple, prepared from recipe - nutritional score 14.00 / 100 |
| Energy | Carbohydrate | Total Fat | Protein | | For a 100g serving : | | | 265.00 kcal (13%) | 37.10 g (29%) | 12.50 g (19%) | 2.40 g (4%) | | | Typical Serving size of 1.000 oz (or 28.35g): | | | 75.13 kcal (4%) | 10.52 g (8%) | 3.54 g (5%) | 0.68 g (1%) | | | Other serving sizes 1.000 piece (1/8 of 9" dia) (or 155.00g): | | | 410.75 kcal (21%) | 57.51 g (44%) | 19.38 g (30%) | 3.72 g (7%) | | | 3. Pie, banana cream, prepared from mix, no-bake type - nutritional score 14.00 / 100 |
| Fiber | Energy | Carbohydrate | Total Fat | Protein | | For a 100g serving : | | | 0.60 g (2%) | 251.00 kcal (13%) | 31.60 g (24%) | 12.90 g (20%) | 3.40 g (6%) | | | Typical Serving size of 1.000 oz (or 28.35g): | | | 0.17 g (1%) | 71.16 kcal (4%) | 8.96 g (7%) | 3.66 g (6%) | 0.96 g (2%) | | | Other serving sizes 1.000 piece (1/8 of 9" dia) (or 92.00g): | | | 0.55 g (2%) | 230.92 kcal (12%) | 29.07 g (22%) | 11.87 g (18%) | 3.13 g (6%) | | | Other serving sizes 1.000 piece (1/6 of 8" pie) (or 123.00g): | | | 0.74 g (3%) | 308.73 kcal (15%) | 38.87 g (30%) | 15.87 g (24%) | 4.18 g (7%) | | | 4. Pie, banana cream, prepared from recipe - nutritional score 14.00 / 100 |
| Fiber | Sugars | Energy | Carbohydrate | Total Fat | Protein | | For a 100g serving : | | | 0.70 g (3%) | 12.06 g (13%) | 269.00 kcal (13%) | 32.90 g (25%) | 13.60 g (21%) | 4.40 g (8%) | | | Typical Serving size of 1.000 oz (or 28.35g): | | | 0.2 g (1%) | 3.42 g (4%) | 76.26 kcal (4%) | 9.33 g (7%) | 3.86 g (6%) | 1.25 g (2%) | | | Other serving sizes 1.000 pie (9" dia) (or 1186.00g): | | | 8.3 g (33%) | 143.03 g (159%) | 3190.34 kcal (160%) | 390.19 g (300%) | 161.3 g (248%) | 52.18 g (93%) | | | Other serving sizes 1.000 piece (1/8 of 9" dia) (or 144.00g): | | | 1.01 g (4%) | 17.37 g (19%) | 387.36 kcal (19%) | 47.38 g (36%) | 19.58 g (30%) | 6.34 g (11%) | | | 5. Pie, blueberry, commercially prepared - nutritional score 14.00 / 100 |
| Fiber | Sugars | Energy | Carbohydrate | Total Fat | Protein | | For a 100g serving : | | | 1.00 g (4%) | 9.89 g (11%) | 232.00 kcal (12%) | 34.90 g (27%) | 10.00 g (15%) | 1.80 g (3%) | | | Typical Serving size of 1.000 oz (or 28.35g): | | | 0.28 g (1%) | 2.8 g (3%) | 65.77 kcal (3%) | 9.89 g (8%) | 2.84 g (4%) | 0.51 g (1%) | | | Other serving sizes 1.000 piece (1/8 of 9" dia) (or 125.00g): | | | 1.25 g (5%) | 12.36 g (14%) | 290 kcal (15%) | 43.63 g (34%) | 12.5 g (19%) | 2.25 g (4%) | | | Other serving sizes 1.000 piece (1/6 of 8" pie) (or 117.00g): | | | 1.17 g (5%) | 11.57 g (13%) | 271.44 kcal (14%) | 40.83 g (31%) | 11.7 g (18%) | 2.11 g (4%) | | | 6. Pie, blueberry, prepared from recipe - nutritional score 14.00 / 100 |
| Energy | Carbohydrate | Total Fat | Protein | | For a 100g serving : | | | 245.00 kcal (12%) | 33.50 g (26%) | 11.90 g (18%) | 2.70 g (5%) | | | Typical Serving size of 1.000 oz (or 28.35g): | | | 69.46 kcal (3%) | 9.5 g (7%) | 3.37 g (5%) | 0.77 g (1%) | | | Other serving sizes 1.000 piece (1/8 of 9" dia) (or 147.00g): | | | 360.15 kcal (18%) | 49.25 g (38%) | 17.49 g (27%) | 3.97 g (7%) | | | 7. Pie, cherry, commercially prepared - nutritional score 14.00 / 100 |
| Fiber | Sugars | Energy | Carbohydrate | Total Fat | Protein | | For a 100g serving : | | | 0.80 g (3%) | 14.29 g (16%) | 260.00 kcal (13%) | 39.80 g (31%) | 11.00 g (17%) | 2.00 g (4%) | | | Typical Serving size of 1.000 oz (or 28.35g): | | | 0.23 g (1%) | 4.05 g (5%) | 73.71 kcal (4%) | 11.28 g (9%) | 3.12 g (5%) | 0.57 g (1%) | | | Other serving sizes 1.000 piece (1/8 of 9" dia) (or 125.00g): | | | 1 g (4%) | 17.86 g (20%) | 325 kcal (16%) | 49.75 g (38%) | 13.75 g (21%) | 2.5 g (4%) | | | Other serving sizes 1.000 piece (1/6 of 8" pie) (or 117.00g): | | | 0.94 g (4%) | 16.72 g (19%) | 304.2 kcal (15%) | 46.57 g (36%) | 12.87 g (20%) | 2.34 g (4%) | | | 8. Pie, cherry, prepared from recipe - nutritional score 14.00 / 100 |
| Energy | Carbohydrate | Total Fat | Protein | | For a 100g serving : | | | 270.00 kcal (14%) | 38.50 g (30%) | 12.20 g (19%) | 2.80 g (5%) | | | Typical Serving size of 1.000 oz (or 28.35g): | | | 76.55 kcal (4%) | 10.91 g (8%) | 3.46 g (5%) | 0.79 g (1%) | | | Other serving sizes 1.000 piece (1/8 of 9" dia) (or 180.00g): | | | 486 kcal (24%) | 69.3 g (53%) | 21.96 g (34%) | 5.04 g (9%) | | | 9. Pie, chocolate creme, commercially prepared - nutritional score 13.00 / 100 |
| Fiber | Sugars | Energy | Carbohydrate | Total Fat | Protein | | For a 100g serving : | | | 0.80 g (3%) | 27.39 g (30%) | 353.00 kcal (18%) | 38.44 g (30%) | 22.41 g (34%) | 4.15 g (7%) | | | Typical Serving size of 1.000 serving .167 pie (or 120.00g): | | | 0.96 g (4%) | 32.87 g (37%) | 423.6 kcal (21%) | 46.13 g (35%) | 26.89 g (41%) | 4.98 g (9%) | | | Other serving sizes 1.000 oz (or 28.35g): | | | 0.23 g (1%) | 7.77 g (9%) | 100.08 kcal (5%) | 10.9 g (8%) | 6.35 g (10%) | 1.18 g (2%) | | | Other serving sizes 1.000 piece (1/4 of 6" pie) (or 99.00g): | | | 0.79 g (3%) | 27.12 g (30%) | 349.47 kcal (17%) | 38.06 g (29%) | 22.19 g (34%) | 4.11 g (7%) | | | Other serving sizes 1.000 piece (1/6 of 8" pie) (or 113.00g): | | | 0.9 g (4%) | 30.95 g (34%) | 398.89 kcal (20%) | 43.44 g (33%) | 25.32 g (39%) | 4.69 g (8%) | | | 10. Pie, chocolate mousse, prepared from mix, no-bake type - nutritional score 14.00 / 100 |
| Energy | Carbohydrate | Total Fat | Protein | | For a 100g serving : | | | 260.00 kcal (13%) | 29.60 g (23%) | 15.40 g (24%) | 3.50 g (6%) | | | Typical Serving size of 1.000 oz (or 28.35g): | | | 73.71 kcal (4%) | 8.39 g (6%) | 4.37 g (7%) | 0.99 g (2%) | | | Other serving sizes 1.000 piece (1/8 of 9" dia) (or 95.00g): | | | 247 kcal (12%) | 28.12 g (22%) | 14.63 g (23%) | 3.33 g (6%) | | | 11. Pie, coconut creme, commercially prepared - nutritional score 13.00 / 100 |
| Fiber | Sugars | Energy | Carbohydrate | Total Fat | Protein | | For a 100g serving : | | | 1.30 g (5%) | 18.52 g (21%) | 298.00 kcal (15%) | 37.30 g (29%) | 16.60 g (26%) | 2.10 g (4%) | | | Typical Serving size of 1.000 oz (or 28.35g): | | | 0.37 g (1%) | 5.25 g (6%) | 84.48 kcal (4%) | 10.57 g (8%) | 4.71 g (7%) | 0.6 g (1%) | | | Other serving sizes 1.000 piece (1/6 of 7" pie) (or 64.00g): | | | 0.83 g (3%) | 11.85 g (13%) | 190.72 kcal (10%) | 23.87 g (18%) | 10.62 g (16%) | 1.34 g (2%) | | | Other serving sizes 1.000 piece (1/8 of 7" pie) (or 48.00g): | | | 0.62 g (2%) | 8.89 g (10%) | 143.04 kcal (7%) | 17.9 g (14%) | 7.97 g (12%) | 1.01 g (2%) | | | 12. Pie, coconut cream, prepared from mix, no-bake type - nutritional score 14.00 / 100 |
| Fiber | Energy | Carbohydrate | Total Fat | Protein | | For a 100g serving : | | | 0.50 g (2%) | 276.00 kcal (14%) | 28.50 g (22%) | 17.60 g (27%) | 2.80 g (5%) | | | Typical Serving size of 1.000 oz (or 28.35g): | | | 0.14 g (1%) | 78.25 kcal (4%) | 8.08 g (6%) | 4.99 g (8%) | 0.79 g (1%) | | | Other serving sizes 1.000 piece (1/8 of 9" dia) (or 94.00g): | | | 0.47 g (2%) | 259.44 kcal (13%) | 26.79 g (21%) | 16.54 g (25%) | 2.63 g (5%) | | | 13. Pie, coconut custard, commercially prepared - nutritional score 14.00 / 100 |
| Fiber | Energy | Carbohydrate | Total Fat | Protein | | For a 100g serving : | | | 1.80 g (7%) | 260.00 kcal (13%) | 30.20 g (23%) | 13.20 g (20%) | 5.90 g (11%) | | | Typical Serving size of 1.000 oz (or 28.35g): | | | 0.51 g (2%) | 73.71 kcal (4%) | 8.56 g (7%) | 3.74 g (6%) | 1.67 g (3%) | | | Other serving sizes 1.000 piece (1/6 of 8" pie) (or 104.00g): | | | 1.87 g (7%) | 270.4 kcal (14%) | 31.41 g (24%) | 13.73 g (21%) | 6.14 g (11%) | | | 14. Pie, egg custard, commercially prepared - nutritional score 14.00 / 100 |
| Fiber | Sugars | Energy | Carbohydrate | Total Fat | Protein | | For a 100g serving : | | | 1.60 g (6%) | 11.58 g (13%) | 210.00 kcal (11%) | 20.80 g (16%) | 11.60 g (18%) | 5.50 g (10%) | | | Typical Serving size of 1.000 oz (or 28.35g): | | | 0.45 g (2%) | 3.28 g (4%) | 59.54 kcal (3%) | 5.9 g (5%) | 3.29 g (5%) | 1.56 g (3%) | | | Other serving sizes 1.000 piece (1/6 of 8" pie) (or 105.00g): | | | 1.68 g (7%) | 12.16 g (14%) | 220.5 kcal (11%) | 21.84 g (17%) | 12.18 g (19%) | 5.78 g (10%) | | | 15. Pie, fried pies, fruit - nutritional score 14.00 / 100 |
| Fiber | Sugars | Energy | Carbohydrate | Total Fat | Protein | | For a 100g serving : | | | 2.60 g (10%) | 21.40 g (24%) | 316.00 kcal (16%) | 42.60 g (33%) | 16.10 g (25%) | 3.00 g (5%) | | | Typical Serving size of 1.000 oz (or 28.35g): | | | 0.74 g (3%) | 6.07 g (7%) | 89.59 kcal (4%) | 12.08 g (9%) | 4.56 g (7%) | 0.85 g (2%) | | | Other serving sizes 1.000 pie (5" x 3-3/4") (or 128.00g): | | | 3.33 g (13%) | 27.39 g (30%) | 404.48 kcal (20%) | 54.53 g (42%) | 20.61 g (32%) | 3.84 g (7%) | | | 16. Pie, lemon meringue, commercially prepared - nutritional score 14.00 / 100 |
| Fiber | Sugars | Energy | Carbohydrate | Total Fat | Protein | | For a 100g serving : | | | 1.20 g (5%) | 23.86 g (27%) | 268.00 kcal (13%) | 47.20 g (36%) | 8.70 g (13%) | 1.50 g (3%) | | | Typical Serving size of 1.000 oz (or 28.35g): | | | 0.34 g (1%) | 6.76 g (8%) | 75.98 kcal (4%) | 13.38 g (10%) | 2.47 g (4%) | 0.43 g (1%) | | | Other serving sizes 1.000 piece (1/6 of 8" pie) (or 113.00g): | | | 1.36 g (5%) | 26.96 g (30%) | 302.84 kcal (15%) | 53.34 g (41%) | 9.83 g (15%) | 1.7 g (3%) | | | 17. Pie, lemon meringue, prepared from recipe - nutritional score 14.00 / 100 |
| Energy | Carbohydrate | Total Fat | Protein | | For a 100g serving : | | | 285.00 kcal (14%) | 39.10 g (30%) | 12.90 g (20%) | 3.80 g (7%) | | | Typical Serving size of 1.000 oz (or 28.35g): | | | 80.8 kcal (4%) | 11.08 g (9%) | 3.66 g (6%) | 1.08 g (2%) | | | Other serving sizes 1.000 piece (1/8 of 9" dia) (or 127.00g): | | | 361.95 kcal (18%) | 49.66 g (38%) | 16.38 g (25%) | 4.83 g (9%) | | | 18. Pie, mince, prepared from recipe - nutritional score 14.00 / 100 |
| Fiber | Sugars | Energy | Carbohydrate | Total Fat | Protein | | For a 100g serving : | | | 2.60 g (10%) | 28.31 g (31%) | 289.00 kcal (14%) | 48.00 g (37%) | 10.80 g (17%) | 2.60 g (5%) | | | Typical Serving size of 1.000 oz (or 28.35g): | | | 0.74 g (3%) | 8.03 g (9%) | 81.93 kcal (4%) | 13.61 g (10%) | 3.06 g (5%) | 0.74 g (1%) | | | Other serving sizes 1.000 piece (1/8 of 9" dia) (or 165.00g): | | | 4.29 g (17%) | 46.71 g (52%) | 476.85 kcal (24%) | 79.2 g (61%) | 17.82 g (27%) | 4.29 g (8%) | | | 19. Pie, peach - nutritional score 14.00 / 100 |
| Fiber | Sugars | Energy | Carbohydrate | Total Fat | Protein | | For a 100g serving : | | | 0.80 g (3%) | 16.23 g (18%) | 224.00 kcal (11%) | 32.90 g (25%) | 10.00 g (15%) | 1.90 g (3%) | | | Typical Serving size of 1.000 oz (or 28.35g): | | | 0.23 g (1%) | 4.6 g (5%) | 63.5 kcal (3%) | 9.33 g (7%) | 2.84 g (4%) | 0.54 g (1%) | | | Other serving sizes 1.000 piece (1/6 of 8" pie) (or 117.00g): | | | 0.94 g (4%) | 18.99 g (21%) | 262.08 kcal (13%) | 38.49 g (30%) | 11.7 g (18%) | 2.22 g (4%) | | | 20. Pie, pecan, commercially prepared - nutritional score 14.00 / 100 |
| Fiber | Sugars | Energy | Carbohydrate | Total Fat | Protein | | For a 100g serving : | | | 2.10 g (8%) | 25.18 g (28%) | 407.00 kcal (20%) | 59.61 g (46%) | 16.69 g (26%) | 4.50 g (8%) | | | Typical Serving size of 1.000 oz (or 28.35g): | | | 0.6 g (2%) | 7.14 g (8%) | 115.38 kcal (6%) | 16.9 g (13%) | 4.73 g (7%) | 1.28 g (2%) | | | Other serving sizes 1.000 slice (or 133.00g): | | | 2.79 g (11%) | 33.49 g (37%) | 541.31 kcal (27%) | 79.28 g (61%) | 22.2 g (34%) | 5.99 g (11%) | | | Other serving sizes 1.000 pie (or 833.00g): | | | 17.49 g (70%) | 209.75 g (233%) | 3390.31 kcal (170%) | 496.55 g (382%) | 139.03 g (214%) | 37.49 g (67%) | | | 21. Pie, pecan, prepared from recipe - nutritional score 14.00 / 100 |
| Energy | Carbohydrate | Total Fat | Protein | | For a 100g serving : | | | 412.00 kcal (21%) | 52.20 g (40%) | 22.20 g (34%) | 4.90 g (9%) | | | Typical Serving size of 1.000 oz (or 28.35g): | | | 116.8 kcal (6%) | 14.8 g (11%) | 6.29 g (10%) | 1.39 g (2%) | | | Other serving sizes 1.000 piece (1/8 of 9" dia) (or 122.00g): | | | 502.64 kcal (25%) | 63.68 g (49%) | 27.08 g (42%) | 5.98 g (11%) | | | 22. Pie, pumpkin, commercially prepared - nutritional score 15.00 / 100 |
| Fiber | Sugars | Energy | Carbohydrate | Total Fat | Protein | | For a 100g serving : | | | 1.80 g (7%) | 18.88 g (21%) | 243.00 kcal (12%) | 34.83 g (27%) | 9.75 g (15%) | 3.90 g (7%) | | | Typical Serving size of 1.000 oz (or 28.35g): | | | 0.51 g (2%) | 5.35 g (6%) | 68.89 kcal (3%) | 9.87 g (8%) | 2.76 g (4%) | 1.11 g (2%) | | | Other serving sizes 1.000 slice (or 133.00g): | | | 2.39 g (10%) | 25.11 g (28%) | 323.19 kcal (16%) | 46.32 g (36%) | 12.97 g (20%) | 5.19 g (9%) | | | Other serving sizes 1.000 pie (or 995.00g): | | | 17.91 g (72%) | 187.86 g (209%) | 2417.85 kcal (121%) | 346.56 g (267%) | 97.01 g (149%) | 38.81 g (69%) | | | 23. Pie, pumpkin, prepared from recipe - nutritional score 16.00 / 100 |
| Energy | Carbohydrate | Total Fat | Protein | | For a 100g serving : | | | 204.00 kcal (10%) | 26.40 g (20%) | 9.30 g (14%) | 4.50 g (8%) | | | Typical Serving size of 1.000 oz (or 28.35g): | | | 57.83 kcal (3%) | 7.48 g (6%) | 2.64 g (4%) | 1.28 g (2%) | | | Other serving sizes 1.000 piece (1/8 of 9" dia) (or 155.00g): | | | 316.2 kcal (16%) | 40.92 g (31%) | 14.42 g (22%) | 6.98 g (12%) | | | 24. Pie, vanilla cream, prepared from recipe - nutritional score 14.00 / 100 |
| Fiber | Sugars | Energy | Carbohydrate | Total Fat | Protein | | For a 100g serving : | | | 0.60 g (2%) | 12.68 g (14%) | 278.00 kcal (14%) | 32.60 g (25%) | 14.40 g (22%) | 4.80 g (9%) | | | Typical Serving size of 1.000 oz (or 28.35g): | | | 0.17 g (1%) | 3.59 g (4%) | 78.81 kcal (4%) | 9.24 g (7%) | 4.08 g (6%) | 1.36 g (2%) | | | Other serving sizes 1.000 piece (1/8 of 9" dia) (or 126.00g): | | | 0.76 g (3%) | 15.98 g (18%) | 350.28 kcal (18%) | 41.08 g (32%) | 18.14 g (28%) | 6.05 g (11%) | | | 25. Pie, apple, commercially prepared, unenriched flour - nutritional score 14.00 / 100 |
| Fiber | Energy | Carbohydrate | Total Fat | Protein | | For a 100g serving : | | | 1.60 g (6%) | 237.00 kcal (12%) | 34.00 g (26%) | 11.00 g (17%) | 1.90 g (3%) | | | Typical Serving size of 1.000 oz (or 28.35g): | | | 0.45 g (2%) | 67.19 kcal (3%) | 9.64 g (7%) | 3.12 g (5%) | 0.54 g (1%) | | | Other serving sizes 1.000 piece (1/8 of 9" dia) (or 125.00g): | | | 2 g (8%) | 296.25 kcal (15%) | 42.5 g (33%) | 13.75 g (21%) | 2.38 g (4%) | | | Other serving sizes 1.000 piece (1/6 of 8" pie) (or 117.00g): | | | 1.87 g (7%) | 277.29 kcal (14%) | 39.78 g (31%) | 12.87 g (20%) | 2.22 g (4%) | | | 26. Pie, fried pies, cherry - nutritional score 14.00 / 100 |
| Fiber | Energy | Carbohydrate | Total Fat | Protein | | For a 100g serving : | | | 2.60 g (10%) | 316.00 kcal (16%) | 42.60 g (33%) | 16.10 g (25%) | 3.00 g (5%) | | | Typical Serving size of 1.000 oz (or 28.35g): | | | 0.74 g (3%) | 89.59 kcal (4%) | 12.08 g (9%) | 4.56 g (7%) | 0.85 g (2%) | | | Other serving sizes 1.000 pie (5" x 3-3/4") (or 128.00g): | | | 3.33 g (13%) | 404.48 kcal (20%) | 54.53 g (42%) | 20.61 g (32%) | 3.84 g (7%) | | | 27. Pie, fried pies, lemon - nutritional score 14.00 / 100 |
| Fiber | Energy | Carbohydrate | Total Fat | Protein | | For a 100g serving : | | | 2.60 g (10%) | 316.00 kcal (16%) | 42.60 g (33%) | 16.10 g (25%) | 3.00 g (5%) | | | Typical Serving size of 1.000 oz (or 28.35g): | | | 0.74 g (3%) | 89.59 kcal (4%) | 12.08 g (9%) | 4.56 g (7%) | 0.85 g (2%) | | | Other serving sizes 1.000 pie (5" x 3-3/4") (or 128.00g): | | | 3.33 g (13%) | 404.48 kcal (20%) | 54.53 g (42%) | 20.61 g (32%) | 3.84 g (7%) | | | 28. Pie, Dutch Apple, Commercially Prepared - nutritional score 14.00 / 100 |
| Fiber | Sugars | Energy | Carbohydrate | Total Fat | Protein | | For a 100g serving : | | | 1.60 g (6%) | 22.02 g (24%) | 290.00 kcal (15%) | 44.54 g (34%) | 11.50 g (18%) | 2.17 g (4%) | | | Typical Serving size of 0.125 pie 1 pie (1/8 of 9" pie) (or 131.00g): | | | 2.1 g (8%) | 28.85 g (32%) | 379.9 kcal (19%) | 58.35 g (45%) | 15.07 g (23%) | 2.84 g (5%) | | | Other serving sizes 1.000 slice (or 137.00g): | | | 2.19 g (9%) | 30.17 g (34%) | 397.3 kcal (20%) | 61.02 g (47%) | 15.76 g (24%) | 2.97 g (5%) | | | Other serving sizes 1.000 pie (or 1137.00g): | | | 18.19 g (73%) | 250.37 g (278%) | 3297.3 kcal (165%) | 506.42 g (390%) | 130.76 g (201%) | 24.67 g (44%) | | |