Welcome to the nutritional density value in 8 different types of blueberries, ranging from 16.00 to 14.00 (out of a maximum of 100) per 100 Calories (kCal). The basic amount from the general description of blueberries is Blueberries, raw. The nutritional density score (out of 100) or nutritional value of Blueberries, raw is 16.00.
Top five blueberries products high in nutritional value
Below is a summary list for the top five blueberries items ranked by the amount or level of nutritional value in 100g. At the bottom of the page is the full list for the 8 different types of blueberries based on the content in different servings in grams and oz (and other serving sizes).1. Blueberries, raw : 16.00%
2. Blueberries, canned, heavy syrup, solids and liquids : 14.00%
3. Blueberries, wild, frozen : 16.00%
4. Blueberries, frozen, unsweetened : 15.00%
5. Blueberries, frozen, sweetened : 14.00%
Following on from the five top blueberries items or products containing nutritional value we have a more comprehensive break down of Blueberries, raw, and the highest item containing nutritional value which is Blueberries, raw. Furthermore we provide a comparison of average values, median values and lowest values along with a comparison with other food groups and assess the effects of storage and preparation on blueberries. Our aim is to provide a comprehensive analysis of the nutritional value content in blueberries.
Nutritional Density Values
The list at thee bottom of the page gives the total nutritional score in the 8 items from the general description 'blueberries' each of which show the nutritional amounts as well as Energy, Protein, Total Fat, Carbohydrate, Fiber and Sugars. The top 8 food items are shown in the graph below, to give a quick and easy dietary comparison for the different items, where each item is listed at the bottom of the page with a nutritional summary.
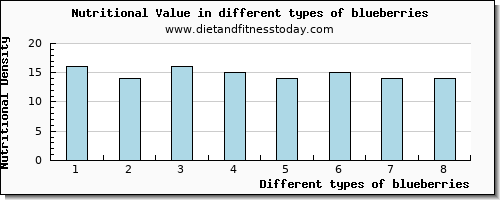
The level of nutritional value can be affected by the method of storage for example canned or frozen and also by the method of preparation for example either raw, cooked or fried. The total number of frozen food items is 3. The highest amount of nutritional value from the 3 frozen items is in Blueberries, wild, frozen where the nutritional value content is 16.00 % per 100g. The number of food items classified as canned is 3 items. The highest amount of nutritional value from the 3 canned items is in Blueberries, canned, heavy syrup, solids and liquids where the score is 14.00 (per 100kCal).The total food items which are raw is 1 item. The highest amount of nutritional value from the 1 raw items is in Blueberries, raw where the nutritional content score is 16.00.
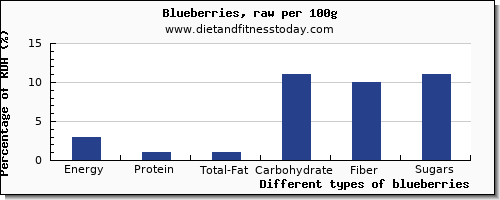
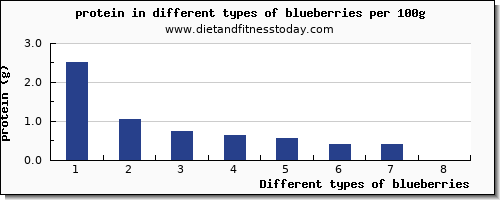
For a serving per 100g, in a diet, the amount of Energy is 57.00 kcal (3% RDA), the amount of Protein is 0.74 g (1% RDA), the amount of Total Fat is 0.33 g (1% RDA), the amount of Carbohydrate is 14.49 g (11% RDA), the amount of Fiber is 2.40 g (10% RDA) and the amount of Sugars is 9.96 g (11% RDA). The nutritional value amounts and nutrition facts for 100g is shown in the bar chart below as percentages of the recommended daily allowance.
For the food Blueberries, raw the typical serving size is 1.000 cup (or 148.00 g). In terms of the gram weight and total content for this serving the Energy content is 84.36 kcal, the Protein content is 1.1 g, the Total Fat content is 0.49 g, the Carbohydrate content is 21.45 g, the Fiber content is 3.55 g and the Sugars content is 14.74 g. 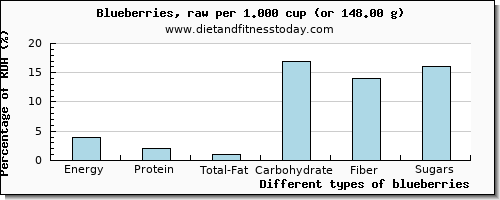
The amount of protein, fat and carbs from this food is measured as a gram weight value although it is also useful to give the calories from these macronutrients. For this serving in your diet here are the macronutrient calories. From protein the number of calories is 3.7 (kcal).The total calories from carbohydrate is 77.2 (kcal).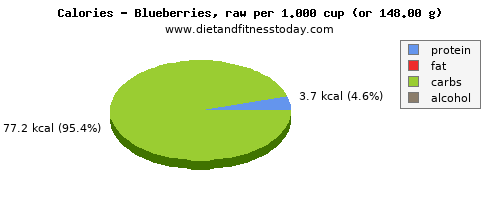
This list of 8 types of blueberries, is brought to you by www.dietandfitnesstoday.com and ranges from Blueberries, raw through to Blueberries, wild, canned, heavy syrup, drained where all food items are ranked by the nutritional value. The nutritional content can be scaled by the amount in grams, oz or typical serving sizes. Simply click on a food item or beverage from the list at the bottom of the page to give a full dietary nutritional breakdown to answer the question what is the nutritional value of blueberries.
Average Content for blueberries
The average (or more correctly the arithmetic mean) amount of nutritional value contained in 100 Calories of blueberries, based on the list below of 8 different items under the general description of blueberries, is 14.75 % of nutritional value. The averages for the different nutrients are as follows; the average amount of Energy is 106.25 kcal, the average amount of Protein is 0.79 g, the average amount of Total Fat is 0.60 g, the average amount of Carbohydrate is 26.94 g, the average amount of Fiber is 3.54 g and the average amount of Sugars is 20.35 g.Median Amount
The median nutritional Nutrition Density value is found in Blueberries, frozen, sweetened which in 100 Calories contains 14.00 % of Nutrition Density. For this serving the amount of Energy is 85.00 kcal, the amount of Protein is 0.40 g, the amount of Total Fat is 0.13 g, the amount of Carbohydrate is 21.95 g, the amount of Fiber is 2.20 g and the amount of Sugars is 19.72 g.
Highest Nutritional Density Content

Using the list below for the 8 different blueberries nutrition entries in our database, the highest amount of nutritional value is found in Blueberries, raw which has a nutritional value of 16.00. For a 100g serving the Energy content is 57.00 kcal, the Protein content is 0.74 g, the Total Fat content is 0.33 g, the Carbohydrate content is 14.49 g, the Fiber content is 2.40 g, the Sugars content is 9.96 g.
The lowest nutritional value is in Blueberries, wild, canned, heavy syrup, drained which has a value of 14.00 % of nutritional value. For a 100g serving the amount of Energy is 107.00 kcal, the amount of Protein is 0.56 g, the amount of Total Fat is 0.34 g, the amount of Carbohydrate is 28.32 g, the amount of Fiber is 4.90 g, the amount of Sugars is 19.28 g.
The difference between the highest and lowest values gives a nutritional value range of 2. The range for the other nutrients are as follows; 50 kcal for Energy, 0.18 g for Protein, 0.01 g for Total Fat, 13.83 g for Carbohydrate, 2.5 g for Fiber, 9.32 g for Sugars.
Nutritional Scores per Typical Serving
For a typical serving of 1.000 cup (or 319.00 g) for Blueberries, wild, canned, heavy syrup, drained the Energy content is 341.33 kcal, the Protein content is 1.79 g, the Total Fat content is 1.08 g, the Carbohydrate content is 90.34 g, the Fiber content is 15.63 g and the Sugars content is 61.5 g.Nutritional Information Summary
From the list below you can find a full nutrition facts breakdown for all foods containing nutritional value which can be scaled for different servings and quantities.
| |||||||||||||||||||||||||||||||||||||||||||||||||||||||||||||||||||||||||||||||||||||||||||||||||||||||||||||||||||||||||||||||||||||||||||||||||||||||||||||||||||||||||||||||||||||||||||||||||||||||||||||||||||||||||||||||||||||||||||||||||||||||||||||||||||||||||||||||||||||||||||||||||||||||||||||||||||||||||||||||||||||||||||||||||||||||||||||||||||||||||||||||||||