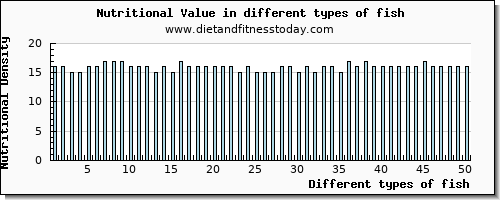
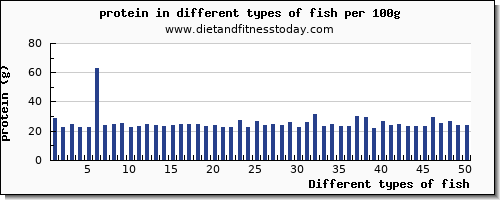
List of Nutritional Values for Fish
|
|
|
| 1. Fish oil, cod liver - nutritional score 902.00 / 100 |
| Carbohydrate
(%RDA) | Total Fat
(%RDA) | Protein
(%RDA) |
| For a 100g serving : |
| (45%) | 0.00 g (0%) | 100.00 g (154%) | 0.00 g (0%) | |
| Typical Serving size of 1.000 tsp (or 4.50g): |
| (2%) | 0 g (0%) | 4.5 g (7%) | 0 g (0%) | |
| Other serving sizes 1.000 tbsp (or 13.60g): |
| (6%) | 0 g (0%) | 13.6 g (21%) | 0 g (0%) | |
| Other serving sizes 1.000 cup (or 218.00g): |
| (98%) | 0 g (0%) | 218 g (335%) | 0 g (0%) | |
| 2. Fish oil, herring - nutritional score 902.00 / 100 |
| Carbohydrate | Total Fat | Protein |
| For a 100g serving : |
| (45%) | 0.00 g (0%) | 100.00 g (154%) | 0.00 g (0%) | |
| Typical Serving size of 1.000 tbsp (or 13.60g): |
| (6%) | 0 g (0%) | 13.6 g (21%) | 0 g (0%) | |
| Other serving sizes 1.000 tsp (or 4.50g): |
| (2%) | 0 g (0%) | 4.5 g (7%) | 0 g (0%) | |
| Other serving sizes 1.000 cup (or 218.00g): |
| (98%) | 0 g (0%) | 218 g (335%) | 0 g (0%) | |
| 3. Fish oil, menhaden - nutritional score 902.00 / 100 |
| Carbohydrate | Total Fat | Protein |
| For a 100g serving : |
| (45%) | 0.00 g (0%) | 100.00 g (154%) | 0.00 g (0%) | |
| Typical Serving size of 1.000 tbsp (or 13.60g): |
| (6%) | 0 g (0%) | 13.6 g (21%) | 0 g (0%) | |
| Other serving sizes 1.000 tsp (or 4.50g): |
| (2%) | 0 g (0%) | 4.5 g (7%) | 0 g (0%) | |
| Other serving sizes 1.000 cup (or 218.00g): |
| (98%) | 0 g (0%) | 218 g (335%) | 0 g (0%) | |
| 4. Fish oil, menhaden, fully hydrogenated - nutritional score 902.00 / 100 |
| Carbohydrate | Total Fat | Protein |
| For a 100g serving : |
| (45%) | 0.00 g (0%) | 100.00 g (154%) | 0.00 g (0%) | |
| Typical Serving size of 1.000 tbsp (or 12.50g): |
| (6%) | 0 g (0%) | 12.5 g (19%) | 0 g (0%) | |
| Other serving sizes 1.000 tsp (or 4.50g): |
| (2%) | 0 g (0%) | 4.5 g (7%) | 0 g (0%) | |
| Other serving sizes 1.000 cup (or 205.00g): |
| (92%) | 0 g (0%) | 205 g (315%) | 0 g (0%) | |
| 5. Fish oil, salmon - nutritional score 902.00 / 100 |
| Carbohydrate | Total Fat | Protein |
| For a 100g serving : |
| (45%) | 0.00 g (0%) | 100.00 g (154%) | 0.00 g (0%) | |
| Typical Serving size of 1.000 tbsp (or 13.60g): |
| (6%) | 0 g (0%) | 13.6 g (21%) | 0 g (0%) | |
| Other serving sizes 1.000 tsp (or 4.50g): |
| (2%) | 0 g (0%) | 4.5 g (7%) | 0 g (0%) | |
| Other serving sizes 1.000 cup (or 218.00g): |
| (98%) | 0 g (0%) | 218 g (335%) | 0 g (0%) | |
| 6. Fish oil, sardine - nutritional score 902.00 / 100 |
| Carbohydrate | Total Fat | Protein |
| For a 100g serving : |
| (45%) | 0.00 g (0%) | 100.00 g (154%) | 0.00 g (0%) | |
| Typical Serving size of 1.000 tbsp (or 13.60g): |
| (6%) | 0 g (0%) | 13.6 g (21%) | 0 g (0%) | |
| Other serving sizes 1.000 tsp (or 4.50g): |
| (2%) | 0 g (0%) | 4.5 g (7%) | 0 g (0%) | |
| Other serving sizes 1.000 cup (or 218.00g): |
| (98%) | 0 g (0%) | 218 g (335%) | 0 g (0%) | |
| 7. Fish, anchovy, european, canned in oil, drained solids - nutritional score 210.00 / 100 |
| Carbohydrate | Total Fat | Protein |
| For a 100g serving : |
| (11%) | 0.00 g (0%) | 9.71 g (15%) | 28.89 g (52%) | |
| Typical Serving size of 1.000 oz and boneless (or 28.35g): |
| (3%) | 0 g (0%) | 2.75 g (4%) | 8.19 g (15%) | |
| Other serving sizes 1.000 anchovy (or 4.00g): |
| (0%) | 0 g (0%) | 0.39 g (1%) | 1.16 g (2%) | |
| Other serving sizes 1.000 can (2 oz) (or 45.00g): |
| (5%) | 0 g (0%) | 4.37 g (7%) | 13 g (23%) | |
| Other serving sizes 5.000 anchovies (or 20.00g): |
| (2%) | 0 g (0%) | 1.94 g (3%) | 5.78 g (10%) | |
| 8. Fish, butterfish, raw - nutritional score 146.00 / 100 |
| Carbohydrate | Total Fat | Protein |
| For a 100g serving : |
| (7%) | 0.00 g (0%) | 8.02 g (12%) | 17.28 g (31%) | |
| Typical Serving size of 1.000 fillet (or 32.00g): |
| (2%) | 0 g (0%) | 2.57 g (4%) | 5.53 g (10%) | |
| Other serving sizes 3.000 oz (or 85.00g): |
| (6%) | 0 g (0%) | 6.82 g (10%) | 14.69 g (26%) | |
| 9. Fish, carp, cooked, dry heat - nutritional score 162.00 / 100 |
| Carbohydrate | Total Fat | Protein |
| For a 100g serving : |
| (8%) | 0.00 g (0%) | 7.17 g (11%) | 22.86 g (41%) | |
| Typical Serving size of 3.000 oz (or 85.00g): |
| (7%) | 0 g (0%) | 6.09 g (9%) | 19.43 g (35%) | |
| Other serving sizes 1.000 fillet (or 170.00g): |
| (14%) | 0 g (0%) | 12.19 g (19%) | 38.86 g (69%) | |
| 10. Fish, catfish, channel, cooked, breaded and fried - nutritional score 229.00 / 100 |
| Carbohydrate | Total Fat | Protein |
| For a 100g serving : |
| (11%) | 8.04 g (6%) | 13.33 g (21%) | 18.09 g (32%) | |
| Typical Serving size of 1.000 fillet (or 87.00g): |
| (10%) | 6.99 g (5%) | 11.6 g (18%) | 15.74 g (28%) | |
| Other serving sizes 3.000 oz (or 85.00g): |
| (10%) | 6.83 g (5%) | 11.33 g (17%) | 15.38 g (27%) | |
| 11. Fish, caviar, black and red, granular - nutritional score 264.00 / 100 |
| Carbohydrate | Total Fat | Protein |
| For a 100g serving : |
| (13%) | 4.00 g (3%) | 17.90 g (28%) | 24.60 g (44%) | |
| Typical Serving size of 1.000 tbsp (or 16.00g): |
| (2%) | 0.64 g (0%) | 2.86 g (4%) | 3.94 g (7%) | |
| Other serving sizes 1.000 oz (or 28.35g): |
| (4%) | 1.13 g (1%) | 5.07 g (8%) | 6.97 g (12%) | |
| 12. Fish, cisco, smoked - nutritional score 177.00 / 100 |
| Carbohydrate | Total Fat | Protein |
| For a 100g serving : |
| (9%) | 0.00 g (0%) | 11.90 g (18%) | 16.36 g (29%) | |
| Typical Serving size of 1.000 oz (or 28.35g): |
| (3%) | 0 g (0%) | 3.37 g (5%) | 4.64 g (8%) | |
| Other serving sizes 3.000 oz (or 85.00g): |
| (8%) | 0 g (0%) | 10.12 g (16%) | 13.91 g (25%) | |
| 13. Fish, cod, Atlantic, dried and salted - nutritional score 290.00 / 100 |
| Carbohydrate | Total Fat | Protein |
| For a 100g serving : |
| (15%) | 0.00 g (0%) | 2.37 g (4%) | 62.82 g (112%) | |
| Typical Serving size of 1.000 oz (or 28.35g): |
| (4%) | 0 g (0%) | 0.67 g (1%) | 17.81 g (32%) | |
| Other serving sizes 1.000 piece (5-1/2" x 1-1/2" x 1/2") (or 80.00g): |
| (12%) | 0 g (0%) | 1.9 g (3%) | 50.26 g (90%) | |
| Other serving sizes 3.000 oz (or 85.00g): |
| (12%) | 0 g (0%) | 2.01 g (3%) | 53.4 g (95%) | |
| 14. Fish, croaker, Atlantic, cooked, breaded and fried - nutritional score 221.00 / 100 |
| Carbohydrate | Total Fat | Protein |
| For a 100g serving : |
| (11%) | 7.54 g (6%) | 12.67 g (19%) | 18.20 g (33%) | |
| Typical Serving size of 1.000 fillet (or 87.00g): |
| (10%) | 6.56 g (5%) | 11.02 g (17%) | 15.83 g (28%) | |
| Other serving sizes 3.000 oz (or 85.00g): |
| (9%) | 6.41 g (5%) | 10.77 g (17%) | 15.47 g (28%) | |
| 15. Fish, eel, mixed species, raw - nutritional score 184.00 / 100 |
| Carbohydrate | Total Fat | Protein |
| For a 100g serving : |
| (9%) | 0.00 g (0%) | 11.66 g (18%) | 18.44 g (33%) | |
| Typical Serving size of 3.000 oz (or 85.00g): |
| (8%) | 0 g (0%) | 9.91 g (15%) | 15.67 g (28%) | |
| Other serving sizes 1.000 fillet (or 204.00g): |
| (19%) | 0 g (0%) | 23.79 g (37%) | 37.62 g (67%) | |
| 16. Fish, eel, mixed species, cooked, dry heat - nutritional score 236.00 / 100 |
| Carbohydrate | Total Fat | Protein |
| For a 100g serving : |
| (12%) | 0.00 g (0%) | 14.95 g (23%) | 23.65 g (42%) | |
| Typical Serving size of 1.000 oz and boneless (or 28.35g): |
| (3%) | 0 g (0%) | 4.24 g (7%) | 6.7 g (12%) | |
| Other serving sizes 1.000 oz with bone (yield after bone removed) (or 22.00g): |
| (3%) | 0 g (0%) | 3.29 g (5%) | 5.2 g (9%) | |
| Other serving sizes 1.000 cubic inch and boneless (or 17.00g): |
| (2%) | 0 g (0%) | 2.54 g (4%) | 4.02 g (7%) | |
| Other serving sizes 1.000 fillet (or 159.00g): |
| (19%) | 0 g (0%) | 23.77 g (37%) | 37.6 g (67%) | |
| Other serving sizes 3.000 oz (or 85.00g): |
| (10%) | 0 g (0%) | 12.71 g (20%) | 20.1 g (36%) | |
| 17. Fish, fish sticks, frozen, prepared - nutritional score 277.00 / 100 |
| Carbohydrate | Total Fat | Protein |
| For a 100g serving : |
| (14%) | 21.66 g (17%) | 16.23 g (25%) | 11.01 g (20%) | |
| Typical Serving size of 1.000 piece (4" x 2" x 1/2") (or 57.00g): |
| (8%) | 12.35 g (10%) | 9.25 g (14%) | 6.28 g (11%) | |
| Other serving sizes 1.000 stick (4" x 1" x 1/2") (or 28.00g): |
| (4%) | 6.06 g (5%) | 4.54 g (7%) | 3.08 g (6%) | |
| 18. Fish, halibut, Greenland, raw - nutritional score 186.00 / 100 |
| Carbohydrate | Total Fat | Protein |
| For a 100g serving : |
| (9%) | 0.00 g (0%) | 13.84 g (21%) | 14.37 g (26%) | |
| Typical Serving size of 3.000 oz (or 85.00g): |
| (8%) | 0 g (0%) | 11.76 g (18%) | 12.21 g (22%) | |
| Other serving sizes 0.500 fillet (or 204.00g): |
| (19%) | 0 g (0%) | 28.23 g (43%) | 29.31 g (52%) | |
| 19. Fish, herring, Atlantic, raw - nutritional score 158.00 / 100 |
| Carbohydrate | Total Fat | Protein |
| For a 100g serving : |
| (8%) | 0.00 g (0%) | 9.04 g (14%) | 17.96 g (32%) | |
| Typical Serving size of 1.000 oz and boneless (or 28.35g): |
| (2%) | 0 g (0%) | 2.56 g (4%) | 5.09 g (9%) | |
| Other serving sizes 1.000 fillet (or 184.00g): |
| (15%) | 0 g (0%) | 16.63 g (26%) | 33.05 g (59%) | |
| Other serving sizes 3.000 oz (or 85.00g): |
| (7%) | 0 g (0%) | 7.68 g (12%) | 15.27 g (27%) | |
| 20. Fish, herring, Atlantic, cooked, dry heat - nutritional score 203.00 / 100 |
| Carbohydrate | Total Fat | Protein |
| For a 100g serving : |
| (10%) | 0.00 g (0%) | 11.59 g (18%) | 23.03 g (41%) | |
| Typical Serving size of 1.000 fillet (or 143.00g): |
| (15%) | 0 g (0%) | 16.57 g (25%) | 32.93 g (59%) | |
| Other serving sizes 3.000 oz (or 85.00g): |
| (9%) | 0 g (0%) | 9.85 g (15%) | 19.58 g (35%) | |
| 21. Fish, herring, Atlantic, pickled - nutritional score 262.00 / 100 |
| Carbohydrate | Total Fat | Protein |
| For a 100g serving : |
| (13%) | 9.64 g (7%) | 18.00 g (28%) | 14.19 g (25%) | |
| Typical Serving size of 1.000 cup (or 140.00g): |
| (18%) | 13.5 g (10%) | 25.2 g (39%) | 19.87 g (35%) | |
| Other serving sizes 1.000 oz and boneless (or 28.35g): |
| (4%) | 2.73 g (2%) | 5.1 g (8%) | 4.02 g (7%) | |
| Other serving sizes 1.000 cubic inch (or 20.00g): |
| (3%) | 1.93 g (1%) | 3.6 g (6%) | 2.84 g (5%) | |
| Other serving sizes 1.000 piece (1-3/4" x 7/8" x 1/2") (or 15.00g): |
| (2%) | 1.45 g (1%) | 2.7 g (4%) | 2.13 g (4%) | |
| 22. Fish, herring, Atlantic, kippered - nutritional score 217.00 / 100 |
| Carbohydrate | Total Fat | Protein |
| For a 100g serving : |
| (11%) | 0.00 g (0%) | 12.37 g (19%) | 24.58 g (44%) | |
| Typical Serving size of 1.000 oz and boneless (or 28.35g): |
| (3%) | 0 g (0%) | 3.51 g (5%) | 6.97 g (12%) | |
| Other serving sizes 1.000 cubic inch and boneless (or 17.00g): |
| (2%) | 0 g (0%) | 2.1 g (3%) | 4.18 g (7%) | |
| Other serving sizes 1.000 fillet and large (7" x 2-1/4" x 1/4") (or 65.00g): |
| (7%) | 0 g (0%) | 8.04 g (12%) | 15.98 g (29%) | |
| Other serving sizes 1.000 fillet and medium (5" x 1-3/4" x 1/4") (or 40.00g): |
| (4%) | 0 g (0%) | 4.95 g (8%) | 9.83 g (18%) | |
| Other serving sizes 1.000 fillet and small (2-3/8" x 1-3/8" x 1/4") (or 20.00g): |
| (2%) | 0 g (0%) | 2.47 g (4%) | 4.92 g (9%) | |
| 23. Fish, herring, Pacific, raw - nutritional score 195.00 / 100 |
| Carbohydrate | Total Fat | Protein |
| For a 100g serving : |
| (10%) | 0.00 g (0%) | 13.88 g (21%) | 16.39 g (29%) | |
| Typical Serving size of 3.000 oz (or 85.00g): |
| (8%) | 0 g (0%) | 11.8 g (18%) | 13.93 g (25%) | |
| Other serving sizes 1.000 fillet (or 184.00g): |
| (18%) | 0 g (0%) | 25.54 g (39%) | 30.16 g (54%) | |
| 24. Fish, mackerel, Atlantic, raw - nutritional score 205.00 / 100 |
| Carbohydrate | Total Fat | Protein |
| For a 100g serving : |
| (10%) | 0.00 g (0%) | 13.89 g (21%) | 18.60 g (33%) | |
| Typical Serving size of 1.000 fillet (or 112.00g): |
| (11%) | 0 g (0%) | 15.56 g (24%) | 20.83 g (37%) | |
| Other serving sizes 3.000 oz (or 85.00g): |
| (9%) | 0 g (0%) | 11.81 g (18%) | 15.81 g (28%) | |
| 25. Fish, mackerel, Atlantic, cooked, dry heat - nutritional score 262.00 / 100 |
| Carbohydrate | Total Fat | Protein |
| For a 100g serving : |
| (13%) | 0.00 g (0%) | 17.81 g (27%) | 23.85 g (43%) | |
| Typical Serving size of 1.000 fillet (or 88.00g): |
| (12%) | 0 g (0%) | 15.67 g (24%) | 20.99 g (37%) | |
| Other serving sizes 3.000 oz (or 85.00g): |
| (11%) | 0 g (0%) | 15.14 g (23%) | 20.27 g (36%) | |
| 26. Fish, mackerel, jack, canned, drained solids - nutritional score 156.00 / 100 |
| Carbohydrate | Total Fat | Protein |
| For a 100g serving : |
| (8%) | 0.00 g (0%) | 6.30 g (10%) | 23.19 g (41%) | |
| Typical Serving size of 1.000 oz and boneless (or 28.35g): |
| (2%) | 0 g (0%) | 1.79 g (3%) | 6.57 g (12%) | |
| Other serving sizes 1.000 cup (or 190.00g): |
| (15%) | 0 g (0%) | 11.97 g (18%) | 44.06 g (79%) | |
| Other serving sizes 1.000 cubic inch (or 16.00g): |
| (1%) | 0 g (0%) | 1.01 g (2%) | 3.71 g (7%) | |
| Other serving sizes 1.000 can (15 oz) (or 361.00g): |
| (28%) | 0 g (0%) | 22.74 g (35%) | 83.72 g (150%) | |
| 27. Fish, mackerel, Pacific and jack, mixed species, raw - nutritional score 158.00 / 100 |
| Carbohydrate | Total Fat | Protein |
| For a 100g serving : |
| (8%) | 0.00 g (0%) | 7.89 g (12%) | 20.07 g (36%) | |
| Typical Serving size of 3.000 oz (or 85.00g): |
| (7%) | 0 g (0%) | 6.71 g (10%) | 17.06 g (30%) | |
| Other serving sizes 1.000 fillet (or 225.00g): |
| (18%) | 0 g (0%) | 17.75 g (27%) | 45.16 g (81%) | |
| 28. Fish, mackerel, spanish, cooked, dry heat - nutritional score 158.00 / 100 |
| Carbohydrate | Total Fat | Protein |
| For a 100g serving : |
| (8%) | 0.00 g (0%) | 6.32 g (10%) | 23.59 g (42%) | |
| Typical Serving size of 1.000 fillet (or 146.00g): |
| (12%) | 0 g (0%) | 9.23 g (14%) | 34.44 g (62%) | |
| Other serving sizes 3.000 oz (or 85.00g): |
| (7%) | 0 g (0%) | 5.37 g (8%) | 20.05 g (36%) | |
| 29. Fish, milkfish, raw - nutritional score 148.00 / 100 |
| Carbohydrate | Total Fat | Protein |
| For a 100g serving : |
| (7%) | 0.00 g (0%) | 6.73 g (10%) | 20.53 g (37%) | |
| Typical Serving size of 3.000 oz (or 85.00g): |
| (6%) | 0 g (0%) | 5.72 g (9%) | 17.45 g (31%) | |
| 30. Fish, mullet, striped, cooked, dry heat - nutritional score 150.00 / 100 |
| Carbohydrate | Total Fat | Protein |
| For a 100g serving : |
| (8%) | 0.00 g (0%) | 4.86 g (7%) | 24.81 g (44%) | |
| Typical Serving size of 1.000 fillet (or 93.00g): |
| (7%) | 0 g (0%) | 4.52 g (7%) | 23.07 g (41%) | |
| Other serving sizes 3.000 oz (or 85.00g): |
| (6%) | 0 g (0%) | 4.13 g (6%) | 21.09 g (38%) | |
| 31. Fish, pompano, florida, raw - nutritional score 164.00 / 100 |
| Carbohydrate | Total Fat | Protein |
| For a 100g serving : |
| (8%) | 0.00 g (0%) | 9.47 g (15%) | 18.48 g (33%) | |
| Typical Serving size of 1.000 oz and boneless (or 28.35g): |
| (2%) | 0 g (0%) | 2.68 g (4%) | 5.24 g (9%) | |
| Other serving sizes 1.000 fillet (or 112.00g): |
| (9%) | 0 g (0%) | 10.61 g (16%) | 20.7 g (37%) | |
| Other serving sizes 3.000 oz (or 85.00g): |
| (7%) | 0 g (0%) | 8.05 g (12%) | 15.71 g (28%) | |
| 32. Fish, pompano, florida, cooked, dry heat - nutritional score 211.00 / 100 |
| Carbohydrate | Total Fat | Protein |
| For a 100g serving : |
| (11%) | 0.00 g (0%) | 12.14 g (19%) | 23.69 g (42%) | |
| Typical Serving size of 1.000 fillet (or 88.00g): |
| (9%) | 0 g (0%) | 10.68 g (16%) | 20.85 g (37%) | |
| Other serving sizes 3.000 oz (or 85.00g): |
| (9%) | 0 g (0%) | 10.32 g (16%) | 20.14 g (36%) | |
| 33. Fish, sablefish, raw - nutritional score 195.00 / 100 |
| Carbohydrate | Total Fat | Protein |
| For a 100g serving : |
| (10%) | 0.00 g (0%) | 15.30 g (24%) | 13.41 g (24%) | |
| Typical Serving size of 3.000 oz (or 85.00g): |
| (8%) | 0 g (0%) | 13.01 g (20%) | 11.4 g (20%) | |
| Other serving sizes 0.500 fillet (or 193.00g): |
| (19%) | 0 g (0%) | 29.53 g (45%) | 25.88 g (46%) | |
| 34. Fish, sablefish, smoked - nutritional score 257.00 / 100 |
| Carbohydrate | Total Fat | Protein |
| For a 100g serving : |
| (13%) | 0.00 g (0%) | 20.14 g (31%) | 17.65 g (32%) | |
| Typical Serving size of 1.000 oz (or 28.35g): |
| (4%) | 0 g (0%) | 5.71 g (9%) | 5 g (9%) | |
| Other serving sizes 3.000 oz (or 85.00g): |
| (11%) | 0 g (0%) | 17.12 g (26%) | 15 g (27%) | |
| 35. Fish, salmon, chinook, raw - nutritional score 179.00 / 100 |
| Carbohydrate | Total Fat | Protein |
| For a 100g serving : |
| (9%) | 0.00 g (0%) | 10.43 g (16%) | 19.93 g (36%) | |
| Typical Serving size of 3.000 oz (or 85.00g): |
| (8%) | 0 g (0%) | 8.87 g (14%) | 16.94 g (30%) | |
| Other serving sizes 0.500 fillet (or 198.00g): |
| (18%) | 0 g (0%) | 20.65 g (32%) | 39.46 g (70%) | |
| 36. Fish, salmon, coho, wild, raw - nutritional score 146.00 / 100 |
| Carbohydrate | Total Fat | Protein |
| For a 100g serving : |
| (7%) | 0.00 g (0%) | 5.93 g (9%) | 21.62 g (39%) | |
| Typical Serving size of 3.000 oz (or 85.00g): |
| (6%) | 0 g (0%) | 5.04 g (8%) | 18.38 g (33%) | |
| Other serving sizes 0.500 fillet (or 198.00g): |
| (14%) | 0 g (0%) | 11.74 g (18%) | 42.81 g (76%) | |
| 37. Fish, salmon, coho, wild, cooked, moist heat - nutritional score 184.00 / 100 |
| Carbohydrate | Total Fat | Protein |
| For a 100g serving : |
| (9%) | 0.00 g (0%) | 7.50 g (12%) | 27.36 g (49%) | |
| Typical Serving size of 3.000 oz (or 85.00g): |
| (8%) | 0 g (0%) | 6.38 g (10%) | 23.26 g (42%) | |
| Other serving sizes 0.500 fillet (or 155.00g): |
| (14%) | 0 g (0%) | 11.63 g (18%) | 42.41 g (76%) | |
| 38. Fish, salmon, sockeye, cooked, dry heat - nutritional score 156.00 / 100 |
| Carbohydrate | Total Fat | Protein |
| For a 100g serving : |
| (8%) | 0.00 g (0%) | 5.57 g (9%) | 26.48 g (47%) | |
| Typical Serving size of 3.000 oz (or 85.00g): |
| (7%) | 0 g (0%) | 4.73 g (7%) | 22.51 g (40%) | |
| Other serving sizes 0.500 fillet (or 155.00g): |
| (12%) | 0 g (0%) | 8.63 g (13%) | 41.04 g (73%) | |
| 39. Fish, salmon, sockeye, canned, drained solids - nutritional score 167.00 / 100 |
| Carbohydrate | Total Fat | Protein |
| For a 100g serving : |
| (8%) | 0.00 g (0%) | 7.39 g (11%) | 23.59 g (42%) | |
| Typical Serving size of 3.000 oz (or 85.00g): |
| (7%) | 0 g (0%) | 6.28 g (10%) | 20.05 g (36%) | |
| Other serving sizes 1.000 can (or 337.00g): |
| (28%) | 0 g (0%) | 24.9 g (38%) | 79.5 g (142%) | |
| 40. Fish, sardine, Atlantic, canned in oil, drained solids with bone - nutritional score 208.00 / 100 |
| Carbohydrate | Total Fat | Protein |
| For a 100g serving : |
| (10%) | 0.00 g (0%) | 11.45 g (18%) | 24.62 g (44%) | |
| Typical Serving size of 1.000 cup and drained (or 149.00g): |
| (15%) | 0 g (0%) | 17.06 g (26%) | 36.68 g (66%) | |
| Other serving sizes 1.000 oz (or 28.35g): |
| (3%) | 0 g (0%) | 3.25 g (5%) | 6.98 g (12%) | |
| Other serving sizes 1.000 cubic inch (or 16.00g): |
| (2%) | 0 g (0%) | 1.83 g (3%) | 3.94 g (7%) | |
| Other serving sizes 1.000 can (3.75 oz) (or 92.00g): |
| (10%) | 0 g (0%) | 10.53 g (16%) | 22.65 g (40%) | |
| Other serving sizes 1.000 small (2-2/3" x 1/2" x 1/4") (or 12.00g): |
| (1%) | 0 g (0%) | 1.37 g (2%) | 2.95 g (5%) | |
| Other serving sizes 2.000 sardines (or 24.00g): |
| (2%) | 0 g (0%) | 2.75 g (4%) | 5.91 g (11%) | |
| 41. Fish, sardine, Pacific, canned in tomato sauce, drained solids with bone - nutritional score 185.00 / 100 |
| Carbohydrate | Total Fat | Protein |
| For a 100g serving : |
| (9%) | 0.54 g (0%) | 10.45 g (16%) | 20.86 g (37%) | |
| Typical Serving size of 1.000 cup (or 89.00g): |
| (8%) | 0.48 g (0%) | 9.3 g (14%) | 18.57 g (33%) | |
| Other serving sizes 1.000 can (or 370.00g): |
| (34%) | 2 g (2%) | 38.67 g (59%) | 77.18 g (138%) | |
| Other serving sizes 1.000 sardine (or 38.00g): |
| (4%) | 0.21 g (0%) | 3.97 g (6%) | 7.93 g (14%) | |
| 42. Fish, shad, american, raw - nutritional score 197.00 / 100 |
| Carbohydrate | Total Fat | Protein |
| For a 100g serving : |
| (10%) | 0.00 g (0%) | 13.77 g (21%) | 16.93 g (30%) | |
| Typical Serving size of 3.000 oz (or 85.00g): |
| (8%) | 0 g (0%) | 11.7 g (18%) | 14.39 g (26%) | |
| Other serving sizes 1.000 fillet (or 184.00g): |
| (18%) | 0 g (0%) | 25.34 g (39%) | 31.15 g (56%) | |
| 43. Fish, shark, mixed species, cooked, batter-dipped and fried - nutritional score 228.00 / 100 |
| Carbohydrate | Total Fat | Protein |
| For a 100g serving : |
| (11%) | 6.39 g (5%) | 13.82 g (21%) | 18.62 g (33%) | |
| Typical Serving size of 3.000 oz (or 85.00g): |
| (10%) | 5.43 g (4%) | 11.75 g (18%) | 15.83 g (28%) | |
| 44. Fish, sturgeon, mixed species, smoked - nutritional score 173.00 / 100 |
| Carbohydrate | Total Fat | Protein |
| For a 100g serving : |
| (9%) | 0.00 g (0%) | 4.40 g (7%) | 31.20 g (56%) | |
| Typical Serving size of 1.000 oz (or 28.35g): |
| (2%) | 0 g (0%) | 1.25 g (2%) | 8.85 g (16%) | |
| Other serving sizes 3.000 oz (or 85.00g): |
| (7%) | 0 g (0%) | 3.74 g (6%) | 26.52 g (47%) | |
| 45. Fish, swordfish, raw - nutritional score 144.00 / 100 |
| Carbohydrate | Total Fat | Protein |
| For a 100g serving : |
| (7%) | 0.00 g (0%) | 6.65 g (10%) | 19.66 g (35%) | |
| Typical Serving size of 3.000 oz (or 85.00g): |
| (6%) | 0 g (0%) | 5.65 g (9%) | 16.71 g (30%) | |
| Other serving sizes 1.000 piece (4-1/2" x 2-1/8" x 7/8") (or 136.00g): |
| (10%) | 0 g (0%) | 9.04 g (14%) | 26.74 g (48%) | |
| 46. Fish, swordfish, cooked, dry heat - nutritional score 172.00 / 100 |
| Carbohydrate | Total Fat | Protein |
| For a 100g serving : |
| (9%) | 0.00 g (0%) | 7.93 g (12%) | 23.45 g (42%) | |
| Typical Serving size of 3.000 oz (or 85.00g): |
| (7%) | 0 g (0%) | 6.74 g (10%) | 19.93 g (36%) | |
| Other serving sizes 1.000 piece (or 106.00g): |
| (9%) | 0 g (0%) | 8.41 g (13%) | 24.86 g (44%) | |
| 47. Fish, tilefish, cooked, dry heat - nutritional score 147.00 / 100 |
| Carbohydrate | Total Fat | Protein |
| For a 100g serving : |
| (7%) | 0.00 g (0%) | 4.69 g (7%) | 24.49 g (44%) | |
| Typical Serving size of 0.500 fillet (or 150.00g): |
| (11%) | 0 g (0%) | 7.04 g (11%) | 36.74 g (66%) | |
| Other serving sizes 3.000 oz (or 85.00g): |
| (6%) | 0 g (0%) | 3.99 g (6%) | 20.82 g (37%) | |
| 48. Fish, trout, mixed species, raw - nutritional score 148.00 / 100 |
| Carbohydrate | Total Fat | Protein |
| For a 100g serving : |
| (7%) | 0.00 g (0%) | 6.61 g (10%) | 20.77 g (37%) | |
| Typical Serving size of 1.000 fillet (or 79.00g): |
| (6%) | 0 g (0%) | 5.22 g (8%) | 16.41 g (29%) | |
| Other serving sizes 3.000 oz (or 85.00g): |
| (6%) | 0 g (0%) | 5.62 g (9%) | 17.65 g (32%) | |
| 49. Fish, trout, rainbow, wild, cooked, dry heat - nutritional score 150.00 / 100 |
| Carbohydrate | Total Fat | Protein |
| For a 100g serving : |
| (8%) | 0.00 g (0%) | 5.82 g (9%) | 22.92 g (41%) | |
| Typical Serving size of 1.000 fillet (or 143.00g): |
| (11%) | 0 g (0%) | 8.32 g (13%) | 32.78 g (59%) | |
| Other serving sizes 3.000 oz (or 85.00g): |
| (6%) | 0 g (0%) | 4.95 g (8%) | 19.48 g (35%) | |
| 50. Fish, tuna, fresh, bluefin, raw - nutritional score 144.00 / 100 |
| Carbohydrate | Total Fat | Protein |
| For a 100g serving : |
| (7%) | 0.00 g (0%) | 4.90 g (8%) | 23.33 g (42%) | |
| Typical Serving size of 3.000 oz (or 85.00g): |
| (6%) | 0 g (0%) | 4.17 g (6%) | 19.83 g (35%) | |
| 51. Fish, tuna, fresh, bluefin, cooked, dry heat - nutritional score 184.00 / 100 |
| Carbohydrate | Total Fat | Protein |
| For a 100g serving : |
| (9%) | 0.00 g (0%) | 6.28 g (10%) | 29.91 g (53%) | |
| Typical Serving size of 3.000 oz (or 85.00g): |
| (8%) | 0 g (0%) | 5.34 g (8%) | 25.42 g (45%) | |
| 52. Fish, tuna, light, canned in oil, drained solids - nutritional score 198.00 / 100 |
| Carbohydrate | Total Fat | Protein |
| For a 100g serving : |
| (10%) | 0.00 g (0%) | 8.21 g (13%) | 29.13 g (52%) | |
| Typical Serving size of 1.000 cup and solid or chunks (or 146.00g): |
| (14%) | 0 g (0%) | 11.99 g (18%) | 42.53 g (76%) | |
| Other serving sizes 1.000 oz (or 28.35g): |
| (3%) | 0 g (0%) | 2.33 g (4%) | 8.26 g (15%) | |
| Other serving sizes 1.000 can (or 171.00g): |
| (17%) | 0 g (0%) | 14.04 g (22%) | 49.81 g (89%) | |
| Other serving sizes 3.000 oz (or 85.00g): |
| (8%) | 0 g (0%) | 6.98 g (11%) | 24.76 g (44%) | |
| Other serving sizes 1.000 can (12.5 oz) and drained (or 321.00g): |
| (32%) | 0 g (0%) | 26.35 g (41%) | 93.51 g (167%) | |
| 53. Fish, tuna, white, canned in oil, drained solids - nutritional score 186.00 / 100 |
| Carbohydrate | Total Fat | Protein |
| For a 100g serving : |
| (9%) | 0.00 g (0%) | 8.08 g (12%) | 26.53 g (47%) | |
| Typical Serving size of 3.000 oz (or 85.00g): |
| (8%) | 0 g (0%) | 6.87 g (11%) | 22.55 g (40%) | |
| Other serving sizes 1.000 can (or 178.00g): |
| (17%) | 0 g (0%) | 14.38 g (22%) | 47.22 g (84%) | |
| 54. Fish, tuna salad - nutritional score 187.00 / 100 |
| Carbohydrate | Total Fat | Protein |
| For a 100g serving : |
| (9%) | 9.41 g (7%) | 9.26 g (14%) | 16.04 g (29%) | |
| Typical Serving size of 3.000 oz (or 85.00g): |
| (8%) | 8 g (6%) | 7.87 g (12%) | 13.63 g (24%) | |
| Other serving sizes 1.000 cup (or 205.00g): |
| (19%) | 19.29 g (15%) | 18.98 g (29%) | 32.88 g (59%) | |
| 55. Fish, yellowtail, mixed species, raw - nutritional score 146.00 / 100 |
| Carbohydrate | Total Fat | Protein |
| For a 100g serving : |
| (7%) | 0.00 g (0%) | 5.24 g (8%) | 23.14 g (41%) | |
| Typical Serving size of 3.000 oz (or 85.00g): |
| (6%) | 0 g (0%) | 4.45 g (7%) | 19.67 g (35%) | |
| Other serving sizes 0.500 fillet (or 187.00g): |
| (14%) | 0 g (0%) | 9.8 g (15%) | 43.27 g (77%) | |
| 56. Fish, salmon, sockeye, canned, without salt, drained solids with bone - nutritional score 153.00 / 100 |
| Carbohydrate | Total Fat | Protein |
| For a 100g serving : |
| (8%) | 0.00 g (0%) | 7.31 g (11%) | 20.47 g (37%) | |
| Typical Serving size of 3.000 oz (or 85.00g): |
| (7%) | 0 g (0%) | 6.21 g (10%) | 17.4 g (31%) | |
| Other serving sizes 1.000 can (or 369.00g): |
| (28%) | 0 g (0%) | 26.97 g (41%) | 75.53 g (135%) | |
| 57. Fish, tuna, light, canned in oil, without salt, drained solids - nutritional score 198.00 / 100 |
| Carbohydrate | Total Fat | Protein |
| For a 100g serving : |
| (10%) | 0.00 g (0%) | 8.21 g (13%) | 29.13 g (52%) | |
| Typical Serving size of 3.000 oz (or 85.00g): |
| (8%) | 0 g (0%) | 6.98 g (11%) | 24.76 g (44%) | |
| Other serving sizes 1.000 can (or 171.00g): |
| (17%) | 0 g (0%) | 14.04 g (22%) | 49.81 g (89%) | |
| 58. Fish, tuna, white, canned in oil, without salt, drained solids - nutritional score 186.00 / 100 |
| Carbohydrate | Total Fat | Protein |
| For a 100g serving : |
| (9%) | 0.00 g (0%) | 8.08 g (12%) | 26.53 g (47%) | |
| Typical Serving size of 3.000 oz (or 85.00g): |
| (8%) | 0 g (0%) | 6.87 g (11%) | 22.55 g (40%) | |
| Other serving sizes 1.000 can (or 178.00g): |
| (17%) | 0 g (0%) | 14.38 g (22%) | 47.22 g (84%) | |
| 59. Fish, bass, freshwater, mixed species, cooked, dry heat - nutritional score 146.00 / 100 |
| Carbohydrate | Total Fat | Protein |
| For a 100g serving : |
| (7%) | 0.00 g (0%) | 4.73 g (7%) | 24.18 g (43%) | |
| Typical Serving size of 1.000 fillet (or 62.00g): |
| (5%) | 0 g (0%) | 2.93 g (5%) | 14.99 g (27%) | |
| Other serving sizes 3.000 oz (or 85.00g): |
| (6%) | 0 g (0%) | 4.02 g (6%) | 20.55 g (37%) | |
| 60. Fish, bluefish, cooked, dry heat - nutritional score 159.00 / 100 |
| Carbohydrate | Total Fat | Protein |
| For a 100g serving : |
| (8%) | 0.00 g (0%) | 5.44 g (8%) | 25.69 g (46%) | |
| Typical Serving size of 1.000 fillet (or 117.00g): |
| (9%) | 0 g (0%) | 6.36 g (10%) | 30.06 g (54%) | |
| Other serving sizes 3.000 oz (or 85.00g): |
| (7%) | 0 g (0%) | 4.62 g (7%) | 21.84 g (39%) | |
| 61. Fish, butterfish, cooked, dry heat - nutritional score 187.00 / 100 |
| Carbohydrate | Total Fat | Protein |
| For a 100g serving : |
| (9%) | 0.00 g (0%) | 10.28 g (16%) | 22.15 g (40%) | |
| Typical Serving size of 1.000 fillet (or 25.00g): |
| (2%) | 0 g (0%) | 2.57 g (4%) | 5.54 g (10%) | |
| Other serving sizes 3.000 oz (or 85.00g): |
| (8%) | 0 g (0%) | 8.74 g (13%) | 18.83 g (34%) | |
| 62. Fish, drum, freshwater, cooked, dry heat - nutritional score 153.00 / 100 |
| Carbohydrate | Total Fat | Protein |
| For a 100g serving : |
| (8%) | 0.00 g (0%) | 6.32 g (10%) | 22.49 g (40%) | |
| Typical Serving size of 3.000 oz (or 85.00g): |
| (7%) | 0 g (0%) | 5.37 g (8%) | 19.12 g (34%) | |
| Other serving sizes 1.000 fillet (or 154.00g): |
| (12%) | 0 g (0%) | 9.73 g (15%) | 34.63 g (62%) | |
| 63. Fish, halibut, greenland, cooked, dry heat - nutritional score 239.00 / 100 |
| Carbohydrate | Total Fat | Protein |
| For a 100g serving : |
| (12%) | 0.00 g (0%) | 17.74 g (27%) | 18.42 g (33%) | |
| Typical Serving size of 3.000 oz (or 85.00g): |
| (10%) | 0 g (0%) | 15.08 g (23%) | 15.66 g (28%) | |
| Other serving sizes 0.500 fillet (or 159.00g): |
| (19%) | 0 g (0%) | 28.21 g (43%) | 29.29 g (52%) | |
| 64. Fish, herring, Pacific, cooked, dry heat - nutritional score 250.00 / 100 |
| Carbohydrate | Total Fat | Protein |
| For a 100g serving : |
| (13%) | 0.00 g (0%) | 17.79 g (27%) | 21.01 g (38%) | |
| Typical Serving size of 1.000 fillet (or 144.00g): |
| (18%) | 0 g (0%) | 25.62 g (39%) | 30.25 g (54%) | |
| Other serving sizes 3.000 oz (or 85.00g): |
| (11%) | 0 g (0%) | 15.12 g (23%) | 17.86 g (32%) | |
| 65. Fish, mackerel, Pacific and jack, mixed species, cooked, dry heat - nutritional score 201.00 / 100 |
| Carbohydrate | Total Fat | Protein |
| For a 100g serving : |
| (10%) | 0.00 g (0%) | 10.12 g (16%) | 25.73 g (46%) | |
| Typical Serving size of 1.000 oz and boneless (or 28.35g): |
| (3%) | 0 g (0%) | 2.87 g (4%) | 7.29 g (13%) | |
| Other serving sizes 1.000 cubic inch and boneless (or 17.00g): |
| (2%) | 0 g (0%) | 1.72 g (3%) | 4.37 g (8%) | |
| Other serving sizes 1.000 fillet (or 176.00g): |
| (18%) | 0 g (0%) | 17.81 g (27%) | 45.28 g (81%) | |
| Other serving sizes 3.000 oz (or 85.00g): |
| (9%) | 0 g (0%) | 8.6 g (13%) | 21.87 g (39%) | |
| 66. Fish, milkfish, cooked, dry heat - nutritional score 190.00 / 100 |
| Carbohydrate | Total Fat | Protein |
| For a 100g serving : |
| (10%) | 0.00 g (0%) | 8.63 g (13%) | 26.32 g (47%) | |
| Typical Serving size of 3.000 oz (or 85.00g): |
| (8%) | 0 g (0%) | 7.34 g (11%) | 22.37 g (40%) | |
| 67. Fish, roe, mixed species, cooked, dry heat - nutritional score 204.00 / 100 |
| Carbohydrate | Total Fat | Protein |
| For a 100g serving : |
| (10%) | 1.92 g (1%) | 8.23 g (13%) | 28.62 g (51%) | |
| Typical Serving size of 1.000 oz (or 28.35g): |
| (3%) | 0.54 g (0%) | 2.33 g (4%) | 8.11 g (14%) | |
| Other serving sizes 3.000 oz (or 85.00g): |
| (9%) | 1.63 g (1%) | 7 g (11%) | 24.33 g (43%) | |
| 68. Fish, sablefish, cooked, dry heat - nutritional score 250.00 / 100 |
| Carbohydrate | Total Fat | Protein |
| For a 100g serving : |
| (13%) | 0.00 g (0%) | 19.62 g (30%) | 17.19 g (31%) | |
| Typical Serving size of 3.000 oz (or 85.00g): |
| (11%) | 0 g (0%) | 16.68 g (26%) | 14.61 g (26%) | |
| Other serving sizes 0.500 fillet (or 151.00g): |
| (19%) | 0 g (0%) | 29.63 g (46%) | 25.96 g (46%) | |
| 69. Fish, salmon, Atlantic, wild, cooked, dry heat - nutritional score 182.00 / 100 |
| Carbohydrate | Total Fat | Protein |
| For a 100g serving : |
| (9%) | 0.00 g (0%) | 8.13 g (13%) | 25.44 g (45%) | |
| Typical Serving size of 3.000 oz (or 85.00g): |
| (8%) | 0 g (0%) | 6.91 g (11%) | 21.62 g (39%) | |
| Other serving sizes 0.500 fillet (or 154.00g): |
| (14%) | 0 g (0%) | 12.52 g (19%) | 39.18 g (70%) | |
| 70. Fish, salmon, chinook, cooked, dry heat - nutritional score 231.00 / 100 |
| Carbohydrate | Total Fat | Protein |
| For a 100g serving : |
| (12%) | 0.00 g (0%) | 13.38 g (21%) | 25.72 g (46%) | |
| Typical Serving size of 3.000 oz (or 85.00g): |
| (10%) | 0 g (0%) | 11.37 g (17%) | 21.86 g (39%) | |
| Other serving sizes 0.500 fillet (or 154.00g): |
| (18%) | 0 g (0%) | 20.61 g (32%) | 39.61 g (71%) | |
| 71. Fish, salmon, chum, cooked, dry heat - nutritional score 154.00 / 100 |
| Carbohydrate | Total Fat | Protein |
| For a 100g serving : |
| (8%) | 0.00 g (0%) | 4.83 g (7%) | 25.82 g (46%) | |
| Typical Serving size of 3.000 oz (or 85.00g): |
| (7%) | 0 g (0%) | 4.11 g (6%) | 21.95 g (39%) | |
| Other serving sizes 0.500 fillet (or 154.00g): |
| (12%) | 0 g (0%) | 7.44 g (11%) | 39.76 g (71%) | |
| 72. Fish, salmon, pink, cooked, dry heat - nutritional score 153.00 / 100 |
| Carbohydrate | Total Fat | Protein |
| For a 100g serving : |
| (8%) | 0.00 g (0%) | 5.28 g (8%) | 24.58 g (44%) | |
| Typical Serving size of 3.000 oz (or 85.00g): |
| (7%) | 0 g (0%) | 4.49 g (7%) | 20.89 g (37%) | |
| Other serving sizes 0.500 fillet (or 124.00g): |
| (9%) | 0 g (0%) | 6.55 g (10%) | 30.48 g (54%) | |
| 73. Fish, shad, american, cooked, dry heat - nutritional score 252.00 / 100 |
| Carbohydrate | Total Fat | Protein |
| For a 100g serving : |
| (13%) | 0.00 g (0%) | 17.65 g (27%) | 21.71 g (39%) | |
| Typical Serving size of 1.000 fillet (or 144.00g): |
| (18%) | 0 g (0%) | 25.42 g (39%) | 31.26 g (56%) | |
| Other serving sizes 3.000 oz (or 85.00g): |
| (11%) | 0 g (0%) | 15 g (23%) | 18.45 g (33%) | |
| 74. Fish, spot, cooked, dry heat - nutritional score 158.00 / 100 |
| Carbohydrate | Total Fat | Protein |
| For a 100g serving : |
| (8%) | 0.00 g (0%) | 6.28 g (10%) | 23.73 g (42%) | |
| Typical Serving size of 1.000 fillet (or 50.00g): |
| (4%) | 0 g (0%) | 3.14 g (5%) | 11.87 g (21%) | |
| Other serving sizes 3.000 oz (or 85.00g): |
| (7%) | 0 g (0%) | 5.34 g (8%) | 20.17 g (36%) | |
| 75. Fish, trout, mixed species, cooked, dry heat - nutritional score 190.00 / 100 |
| Carbohydrate | Total Fat | Protein |
| For a 100g serving : |
| (10%) | 0.00 g (0%) | 8.47 g (13%) | 26.63 g (48%) | |
| Typical Serving size of 1.000 fillet (or 62.00g): |
| (6%) | 0 g (0%) | 5.25 g (8%) | 16.51 g (29%) | |
| Other serving sizes 3.000 oz (or 85.00g): |
| (8%) | 0 g (0%) | 7.2 g (11%) | 22.64 g (40%) | |
| 76. Fish, whitefish, mixed species, cooked, dry heat - nutritional score 172.00 / 100 |
| Carbohydrate | Total Fat | Protein |
| For a 100g serving : |
| (9%) | 0.00 g (0%) | 7.51 g (12%) | 24.47 g (44%) | |
| Typical Serving size of 3.000 oz (or 85.00g): |
| (7%) | 0 g (0%) | 6.38 g (10%) | 20.8 g (37%) | |
| Other serving sizes 1.000 fillet (or 154.00g): |
| (13%) | 0 g (0%) | 11.57 g (18%) | 37.68 g (67%) | |
| 77. Fish, yellowtail, mixed species, cooked, dry heat - nutritional score 187.00 / 100 |
| Carbohydrate | Total Fat | Protein |
| For a 100g serving : |
| (9%) | 0.00 g (0%) | 6.72 g (10%) | 29.67 g (53%) | |
| Typical Serving size of 0.500 fillet (or 146.00g): |
| (14%) | 0 g (0%) | 9.81 g (15%) | 43.32 g (77%) | |
| Other serving sizes 3.000 oz (or 85.00g): |
| (8%) | 0 g (0%) | 5.71 g (9%) | 25.22 g (45%) | |
| 78. Fish, catfish, channel, farmed, cooked, dry heat - nutritional score 144.00 / 100 |
| Carbohydrate | Total Fat | Protein |
| For a 100g serving : |
| (7%) | 0.00 g (0%) | 7.19 g (11%) | 18.44 g (33%) | |
| Typical Serving size of 1.000 fillet (or 143.00g): |
| (10%) | 0 g (0%) | 10.28 g (16%) | 26.37 g (47%) | |
| Other serving sizes 3.000 oz (or 85.00g): |
| (6%) | 0 g (0%) | 6.11 g (9%) | 15.67 g (28%) | |
| 79. Fish, salmon, Atlantic, farmed, raw - nutritional score 208.00 / 100 |
| Carbohydrate | Total Fat | Protein |
| For a 100g serving : |
| (10%) | 0.00 g (0%) | 13.42 g (21%) | 20.42 g (36%) | |
| Typical Serving size of 3.000 oz (or 85.00g): |
| (9%) | 0 g (0%) | 11.41 g (18%) | 17.36 g (31%) | |
| Other serving sizes 0.500 fillet (or 198.00g): |
| (21%) | 0 g (0%) | 26.57 g (41%) | 40.43 g (72%) | |
| 80. Fish, salmon, Atlantic, farmed, cooked, dry heat - nutritional score 206.00 / 100 |
| Carbohydrate | Total Fat | Protein |
| For a 100g serving : |
| (10%) | 0.00 g (0%) | 12.35 g (19%) | 22.10 g (39%) | |
| Typical Serving size of 3.000 oz (or 85.00g): |
| (9%) | 0 g (0%) | 10.5 g (16%) | 18.79 g (34%) | |
| Other serving sizes 0.500 fillet (or 178.00g): |
| (18%) | 0 g (0%) | 21.98 g (34%) | 39.34 g (70%) | |
| 81. Fish, salmon, coho, farmed, raw - nutritional score 160.00 / 100 |
| Carbohydrate | Total Fat | Protein |
| For a 100g serving : |
| (8%) | 0.00 g (0%) | 7.67 g (12%) | 21.27 g (38%) | |
| Typical Serving size of 3.000 oz (or 85.00g): |
| (7%) | 0 g (0%) | 6.52 g (10%) | 18.08 g (32%) | |
| Other serving sizes 1.000 fillet (or 159.00g): |
| (13%) | 0 g (0%) | 12.2 g (19%) | 33.82 g (60%) | |
| 82. Fish, salmon, coho, farmed, cooked, dry heat - nutritional score 178.00 / 100 |
| Carbohydrate | Total Fat | Protein |
| For a 100g serving : |
| (9%) | 0.00 g (0%) | 8.23 g (13%) | 24.30 g (43%) | |
| Typical Serving size of 1.000 fillet (or 143.00g): |
| (13%) | 0 g (0%) | 11.77 g (18%) | 34.75 g (62%) | |
| Other serving sizes 3.000 oz (or 85.00g): |
| (8%) | 0 g (0%) | 7 g (11%) | 20.66 g (37%) | |
| 83. Fish, trout, rainbow, farmed, cooked, dry heat - nutritional score 168.00 / 100 |
| Carbohydrate | Total Fat | Protein |
| For a 100g serving : |
| (8%) | 0.00 g (0%) | 7.38 g (11%) | 23.80 g (43%) | |
| Typical Serving size of 1.000 fillet (or 71.00g): |
| (6%) | 0 g (0%) | 5.24 g (8%) | 16.9 g (30%) | |
| Other serving sizes 3.000 oz (or 85.00g): |
| (7%) | 0 g (0%) | 6.27 g (10%) | 20.23 g (36%) | |
| 84. Fish, mackerel, salted - nutritional score 305.00 / 100 |
| Carbohydrate | Total Fat | Protein |
| For a 100g serving : |
| (15%) | 0.00 g (0%) | 25.10 g (39%) | 18.50 g (33%) | |
| Typical Serving size of 1.000 piece (5-1/2" x 1-1/2" x 1/2") (or 80.00g): |
| (12%) | 0 g (0%) | 20.08 g (31%) | 14.8 g (26%) | |
| Other serving sizes 1.000 cubic inch and boneless (or 17.00g): |
| (3%) | 0 g (0%) | 4.27 g (7%) | 3.15 g (6%) | |